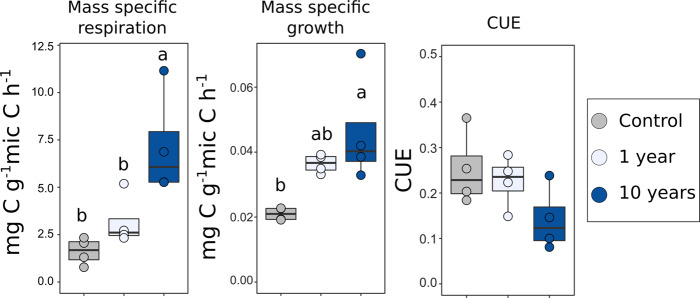
Fig. 4. Physiological parameters measured upon rewetting.
Colour indicates soil treatment (control = grey, 1 year = light blue, 10 years = blue). Drought had a significant effect on mass-specific respiration and growth rates (respectively, F-value = 9.67, p = 0.006, n = 4 and F-value = 14.55, p = 0.0015, n = 4), whereas it had no significant effect on CUE. The 10-year drought was significantly different from 1-year drought in mass-specific respiration rates. Letters represent results from two-sided Tukey HSD post hoc test. Box centre line represents median, box limits the upper and lower quartiles, whiskers the 1.5x interquartile range, while separated points represent outliers. The sample size ‘n’ represents biologically independent samples.

