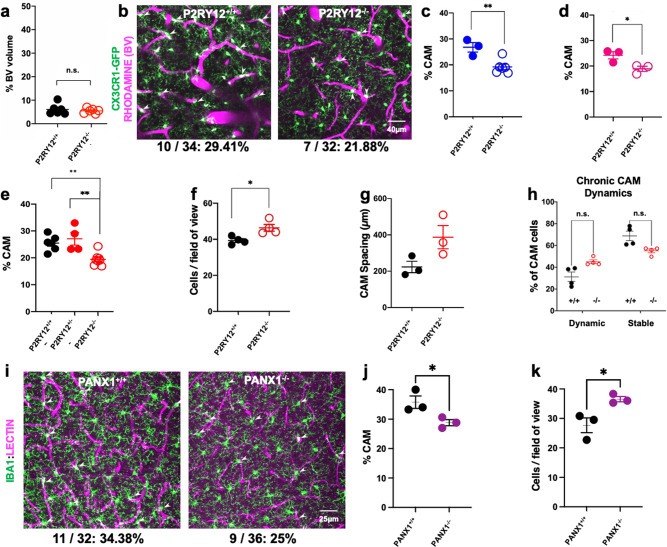
Fig. 4. P2RY12- and PANX1-dependent regulation of CAM interactions.
a Quantification of the blood vessel volume when compared to total brain volume in P2RY12+/+ and P2RY12−/− mice. n = 6 mice each. b–d Representative 20-µm-thick two-photon projection images (p) and quantification in males (c, n = 3–5 mice each) and females (d, n = 3 mice each) from a CX3CR1GFP/+ adult brain showing capillary- (magenta) associated microglia (green, arrowheads) in P2RY12+/+ and P2RY12−/− mice (n = 3–5 mice each). e Quantification of CAM density relative to total microglial density in P2RY12+/+, P2RY12+/−, and P2RY12−/− mice (n = 4–6 mice each). f Quantification of microglial density in the in vivo cortical regions imaged in P2RY12+/+ and P2RY12−/− mice (n = 4 mice each). g Quantification of the spacing between microglia along the vasculature in P2RY12+/+ and P2RY12−/− mice (n = 3 mice each). h Quantification of CAM dynamics in P2RY12+/+ and P2RY12−/− mice (n = 4 mice each). i–k Representative 20-µm-thick confocal projection images (i) and quantification of CAM density (j) and microglial cell density- (k) showing capillary- (magenta) associated microglia (green, arrowheads) in PANX1+/+ and PANX1−/− mice (n = 3 mice each). Data are presented as mean values ± SEM. *p < 0.05, **p < 0.01, and n.s. not significant. Two-sided unpaired Student’s t test in a, c, d, f, g, h, j, and k.

