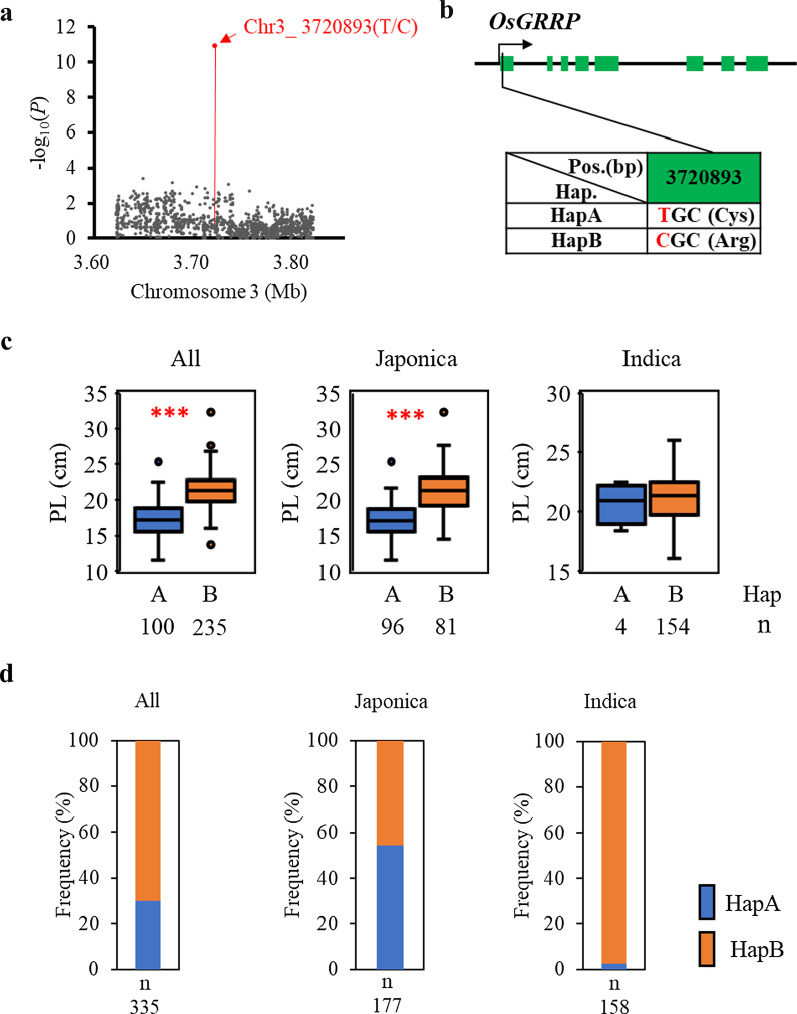
Fig. 4.
Haplotype analysis of the candidate gene in qPL3-7. a Local Manhattan plot of qPL3-3 on chromosome 3. The red arrow indicates the position of the lead SNP. b Schematic representation of OsGRRP gene structure and the position of peak SNP used for haplotype analysis. Green boxes indicate exons. c Box plots for panicle length (PL) in the two haplotypes of OsGRRP in all, japonica, and indica accessions in 2017. Number of accessions (n) of each haplotype (Hap) in each panel given under the x-axis. Boxes show median, and upper and lower quartiles. Whiskers extend to 1.5 × the interquartile range, with any remaining points indicated with dots. ***P < 0.001 (Welch two sample t-test). d Frequencies of the two OsGRRP haplotypes in all, japonica, and indica accessions. n, number of accessions in each panel

