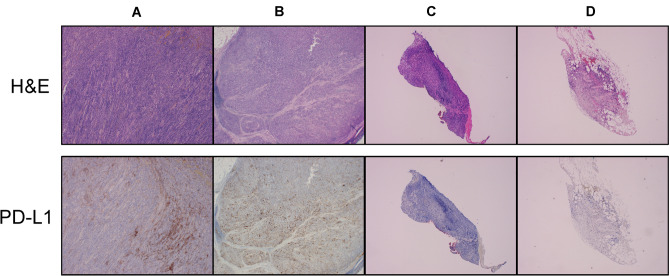
Fig. 4.
Upper images: Hematoxylin and eosin (H&E) staining of the tumor tissues (×40). Lower images: PD-L1 expression determined by an immunohistochemistry assay using the PD-L1 IHC 22C3 pharmDx kit. PD-L1 protein expression was determined by combined positive score (CPS). A Primary tumor, CPS 15–20%; B lymph node, CPS 20–30%; C endoscopic biopsy samples, CPS 1–5%; D peritoneal dissemination, 1–5% (×40)

