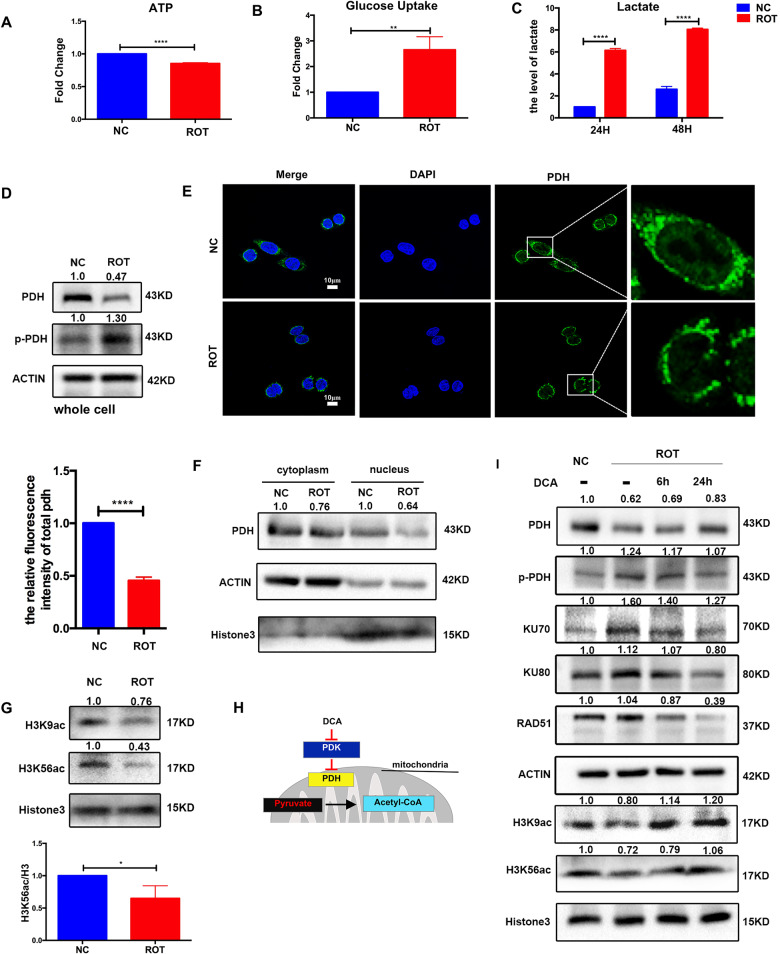
Fig. 3. Downregulation of PDH in complex I deficient cells contributed to glycolysis and DDR.
A–C Complex I deficient cells showed decreased ATP level (A) and increased glucose uptake (B), lactate secretion (C) compared with that in control cells. (n = 3), **P < 0.01, ****P < 0.0001. D Levels of PDH and p-PDH protein in NC and ROT cells. E Confocal photography showed the levels of PDH (green) and DAPI (blue) in the cytoplasm and nucleus in NC and ROT cells. Magnified areas taken at ×5 magnification, scale bar: 10 μm. Relative fluorescence intensity was shown. (n = 5), ****P < 0.0001. F Study of PDH expression in extracted nucleus and cytoplasm of NC and ROT cells by western blot. G Levels of H3K9ac and H3k56ac protein in NC and ROT cells, Relative protein levels of H3K56ac were normalized to H3 (n = 3), *P < 0.05. H Mechanism for DCA-mediated increase in histone acetylation. I Western blot analysis of PDH, H3K9ac, H3k56ac, DNA repair protein in NC cells and ROT cells with or without DCA (5 mM) for 6 h and 24 h in ROT group. Data are presented as the means ± s.e.m.

