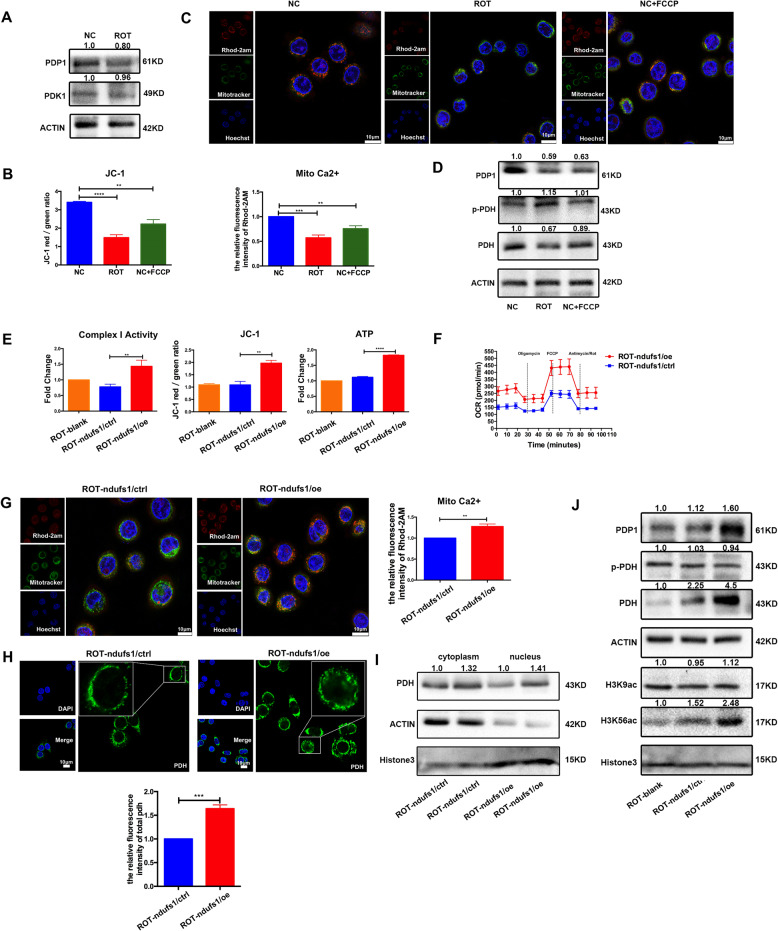
Fig. 4. Complex I deficiency activated the [Ca2+]m–PDP1-PDH-histone acetylation retrograde signaling pathway.
A Western blot analysis of PDK1 and PDP1 protein in NC and ROT cells. B Statistical analysis of ΔΨm in NC, NC + FCCP (10 μM), ROT cells. (n = 3), **P < 0.01, ****P < 0.0001. C The above cells were incubated with the fluorescent dyes Rhod-2AM (5 μM, red), Mitotracker (200 nM, green) and Hoechst (2 μg/ml, blue), rotenone and FCCP caused a rapid decrease in [Ca2+]m. Scale bar:10 μm. Relative fluorescence intensity was shown, (n = 3), **P < 0.01, ***P < 0.001. D Levels of PDP1, p-PDH, and PDH protein in NC, NC + FCCP, and ROT cells. E–F Overexpression of NDUFS1 could increase complex I activity, oxygen consumption, ATP and the ΔΨm. (n = 3), **P < 0.01, ****P < 0.0001. G [Ca2+]m level in ROT-ndufs1/ctrl and ROT-ndufs1/oe cells. Scale bar:10 μm. Relative fluorescence intensity was shown, (n = 3), **P < 0.01. H IF staining of PDH in ROT-ndufs1/ctrl and ROT-ndufs1/oe cells, scale bar:10 μm. Relative fluorescence intensity was shown, (n = 5), ***P < 0.001. I Levels of PDH expression in extracted nucleus and cytoplasm in ROT-ndufs1/ctrl and ROT-ndufs1/oe cells. J Western blot analysis of PDP1, p-PDH, PDH and histone acetylation protein in ROT-balnk, ROT-ndufs1/ctrl and ROT-ndufs1/oe cells. Data are presented as the means ± s.e.m.

