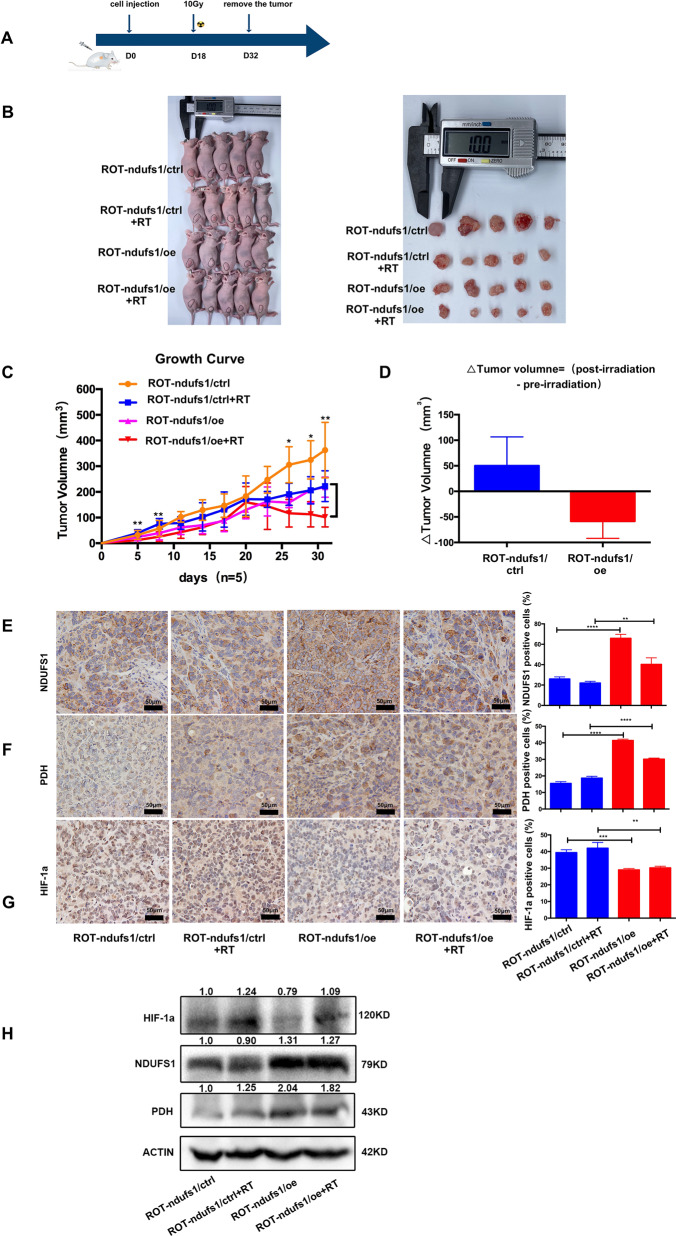
Fig. 6. NDUFS1-overexpression increased radiosensitivity in xenograft model.
A Treatment schema. B Tumor images after all the mice were killed and tumors were removed. C Tumor size was measured every 3 days, control+ irradiation vs oe + irradiation, (n = 5), *P < 0.05 **p < 0.01. D △Tumor Volume = (post-irradiation-pre-irradiation) in ROT-ndufs1/ctrl and ROT-ndufs1/oe groups. E Representative images of IHC staining of NDUFS1in different tumor tissues. Brown: NDUFS1-positive cells. (n = 3), **P < 0.01, ***P < 0.001. F IHC staining of PDH in different tumor tissues. (n = 3), ****P < 0.0001. G IHC staining of HIF-1α in different tumor tissues. (n = 3), **P < 0.01, ***P < 0.001. H Expression of NDUF1, PDH, HIF-1a in tumor tissues by western blot. Data are presented as the means ± s.e.m.

