Figure 4.

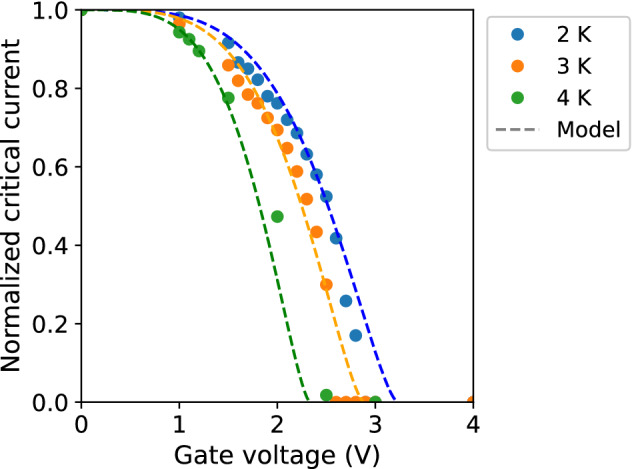
Normalized critical current–gate voltage characteristic. Dots indicate the experimental data at 2, 3, and 4 K. Dashed lines represent the predicted characteristics at the corresponding temperatures (Eq. 10) with V.

Normalized critical current–gate voltage characteristic. Dots indicate the experimental data at 2, 3, and 4 K. Dashed lines represent the predicted characteristics at the corresponding temperatures (Eq. 10) with V.