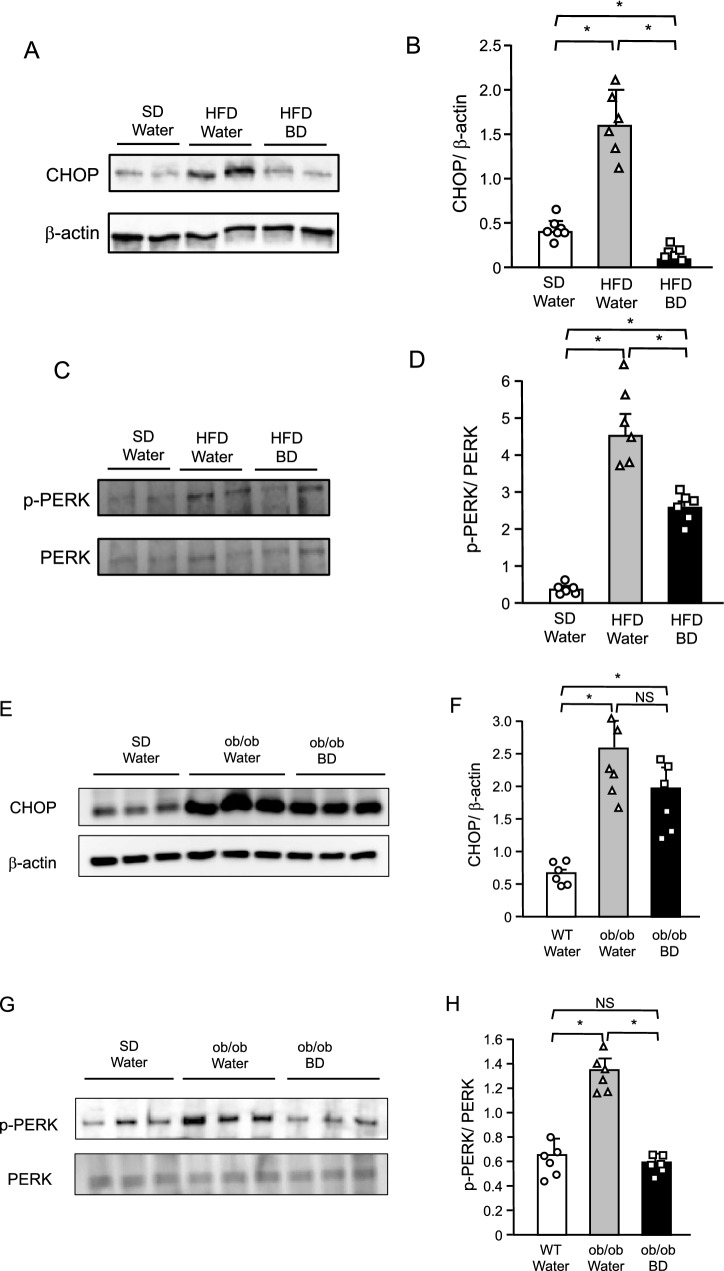
Figure 7.
Effect of BD on expression of ER stress marker in the hypothalamus of DIO (A–D) and ob/ob (E–H) mice. (A,E) Western blot analyses for CHOP and β-actin protein levels in the hypothalamus. (B,F) Ratio of signal intensities of CHOP to β-actin in A and E. (C,G) Western blot analyses for p-PERK and total PERK protein levels in the hypothalamus. (D,H) Ratio of signal intensities of p-PERK to total PERK in C and G. Values are means ± SEM (A–D, n = 7 for SD + Water, 6 for HFD + Water, 6 for HFD + BD; E–H, n = 6 for WT + Water, 6 for ob/ob + Water, 6 for ob/ob + BD). NS, not significant, *P < 0.05 (Student’s t-test).

