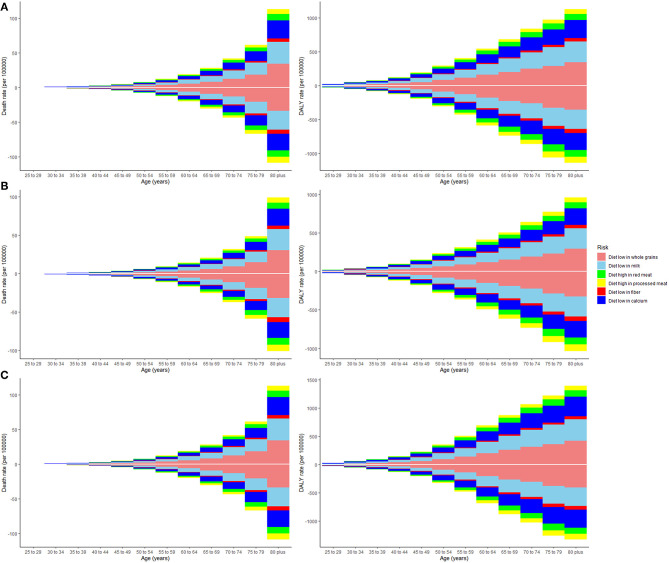
Figure 2.
The death and disability-adjusted life-years (DALY) rate of six dietary risk factors related to colorectal cancer among various age groups. The upper column in each group represents data in 2019, and the lower column in each group represents data in 1990. The vertical axis is the death or DALY rate (per 100,000 persons). The horizontal axis represents different age groups. (A) Both genders, (B) women, and (C) men.

