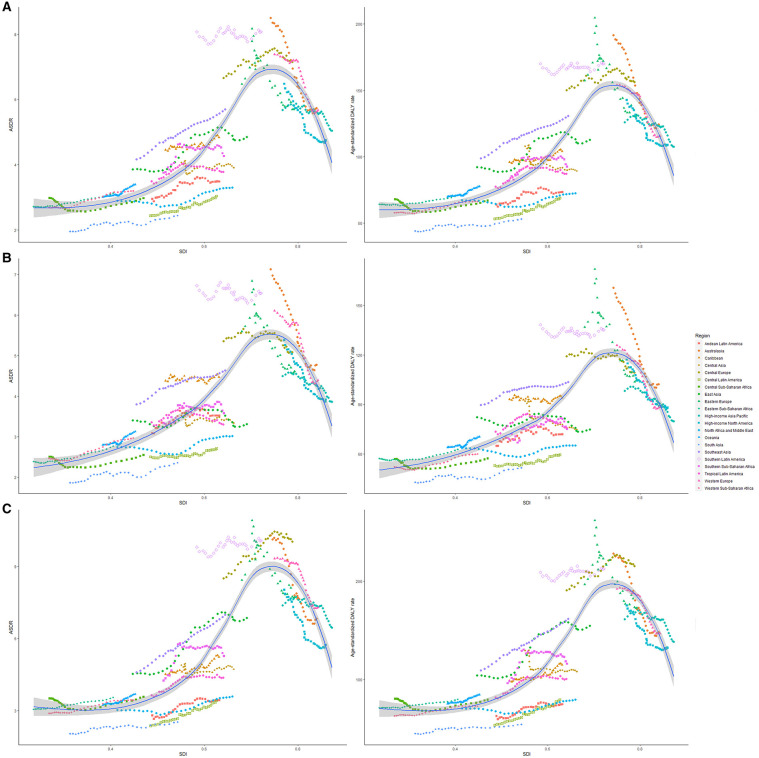
Figure 4.
The ASRs of dietary risk related colorectal cancer among 21 regions based on SDI in 2019. The vertical axis is the age-standardized death and DALY rate (per 100,000 person-years), and the horizontal axis is the SDI value in 2019. Each combination of colors and shapes represents a region. Each point represents the age-standardized death and DALY rate (per 100,000 person-years) that year in each region. Each combination of the same color and shape, from front to back, represents the data for each year from 1990 to 2019. (A) ASDR or age-standardized DALY rate for both genders; (B) ASDR or age-standardized DALY rate for women; and (C) ASDR or age-standardized DALY rate for men. ASDR, age-standardized death rate; DALY, disability-adjusted life-year; SDI, socio-demographic index.

