Figure 2.

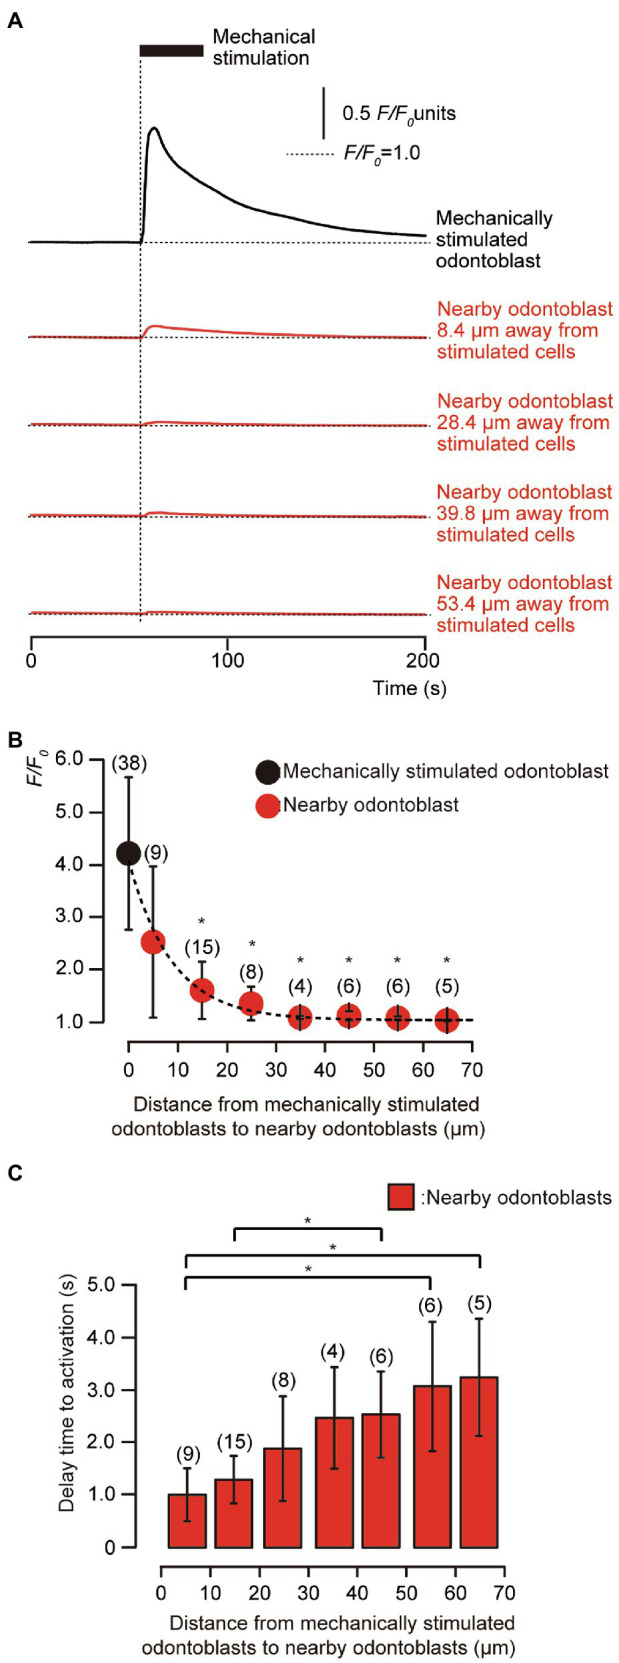
Transient [Ca2+]i increases in mechanical-stimulated human odontoblast and neighboring human odontoblasts to the stimulated cells. (A) Representative traces indicating transiently increased [Ca2+]i from a mechanically stimulated human odontoblast (black line) and neighboring human odontoblasts (red lines) in standard extracellular solution. Horizontal dotted lines indicate the baseline (F/F0=1.0) for each response, while vertical dotted line represents the time when mechanical stimulation was applied. The black box at the top shows the timing of mechanical stimulation by the displacement of a micropipette to a depth of 8.0μm. Responses from the nearby human odontoblasts were recorded in cells at 8.4μm, 28.4μm, 39.8μm, and 53.4μm away from the stimulated human odontoblast. (B) The F/F0 values of the mechanically stimulated odontoblasts (black circle) and nearby odontoblasts (red circles) located within 0–10μm, 11–20μm, 21–30μm, 31–40μm, 41–50μm, 51–60μm, and 61–70μm from the stimulated human odontoblasts are shown. The kinetics of the distance-dependent decrease of [Ca2+]i were described well by the single exponential function (dotted line), showing spatial constants of the distance-dependent decrease of 6.11±0.76μm. Circles indicate the mean±SD. Numbers in parentheses indicate the number of cells tested. The [Ca2+]i increases in neighboring odontoblasts were reduced by increasing their distance from mechanically stimulated cells. (C) Bar graph representing the mean time to increases in [Ca2+]i in neighboring odontoblasts, during the mechanical stimulation to single odontoblasts. The delay time in [Ca2+]i increase was measured by calculating the time between the onset of the mechanical stimulation of the odontoblasts and time require to achieve the rising phase for each [Ca2+]i response in neighboring cells. Each data point indicates the mean±SD from the number of cells tested (numbers in parentheses). Statistically significant differences in (B,C) between values are indicated by asterisks. *p<0.05.
