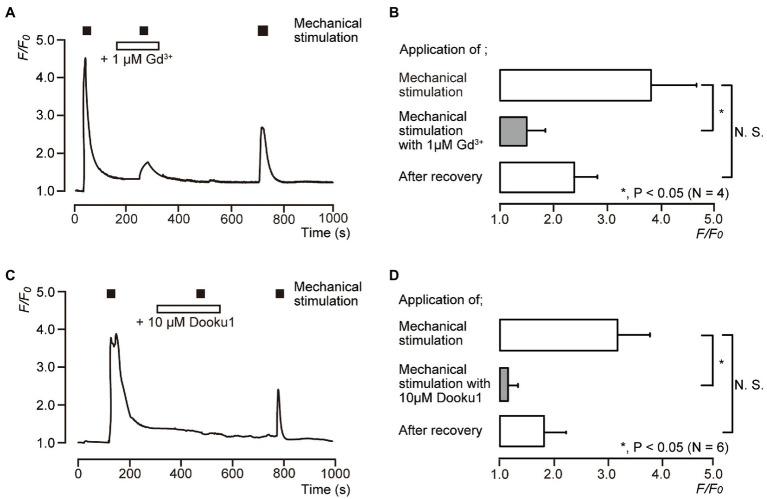
Figure 4.
Direct mechanical stimulation-evoked [Ca2+]i increases mediated by a Piezo1 channel. (A,C) Representative traces of transient increases in [Ca2+]i during mechanical stimulations induced by vertical micropipette displacement downward by 8.0μm (black boxes at the top in A,C) in standard extracellular solution with (white boxes at the top) or without 1μM Gd3+ (A) or 10μM Dooku1 (C). (B,D) Bar graphs of the values of [Ca2+]i increases induced by mechanical stimulation (to 8.0μm) without (open columns) or with (gray columns) pharmacological inhibitors, 1μM Gd3+ (B), or 10μM Dooku1 (D). Each of the most lower open columns indicates the F/F0 values after recovery. The resting value is shown as F/F0=1.0. Each bar indicates the mean±SD of four (B) and six (D) cells tested. Asterisks denote statistically significant differences between columns (shown by solid lines): *p<0.05; N.S., not significant.

