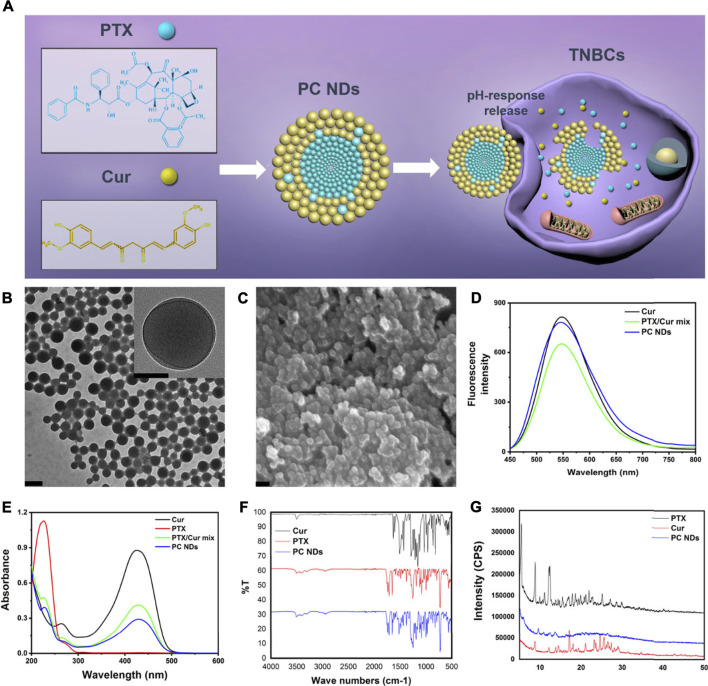
FIGURE 1.
Scheme of PC NDs preparation and its characterization. (A) Scheme of PC NDs preparation. PC NDs has been prepared using a reprecipitation method and shown pH-sensitive drug release behavior in tumor cells. (B) TEM images of PC NDs. Scale bars are 200 and 50 nm (inset), respectively. (C) SEM image of PC NDs. Scale bar is 200 nm. (D) Emission spectra of Cur, PTX/Cur mix, and PC NDs. (E) UV-vis absorption spectra of Cur, PTX, PTX/Cur mix, and PC NDs. (F) FTIR spectra of Cur, PTX, and PC NDs. (G) XRD spectra of Cur, PTX, and PC NDs.

