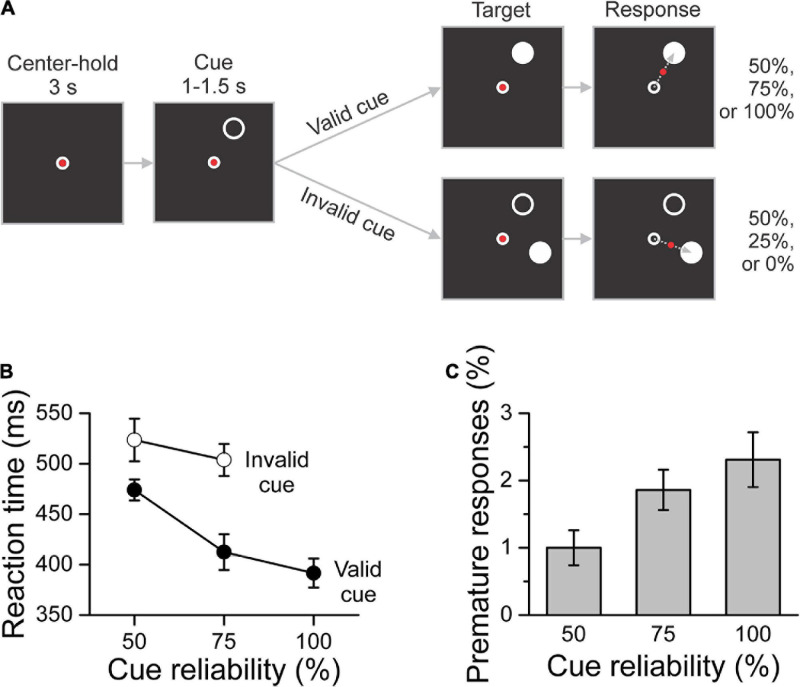
FIGURE 1.
Task and behavioral results. (A) Schematic description of the task. After a 3 s center-hold period, a peripheral cue (white circle) was presented for 1–1.5 s in any direction around the center. The direction of the cue was selected randomly in the 0–360 deg range from trial to trial. The cue indicated the location of the upcoming target (white disc) with 50, 75, or 100% reliability depending on the block of trials. Participants were informed of the cue reliability condition before the start of the block of trials. After target onset, which determined whether the trial had a valid or invalid cue, participants responded by moving a joystick-controlled cursor (red dot) from the center of the screen to the target as quickly and accurately as possible. (B) Mean reaction time across participants per cue reliability and cue validity conditions. Mean reaction time decreased significantly as cue reliability increased and was significantly shorter for valid-cue trials than for invalid-cue trials. (C) Percent of premature responses per cue reliability condition averaged across participants. The percent of premature responses increased significantly with cue reliability. The error bars indicate the SEM (N = 12 participants) for within-subject designs (Cousineau, 2005; Morey, 2008).

