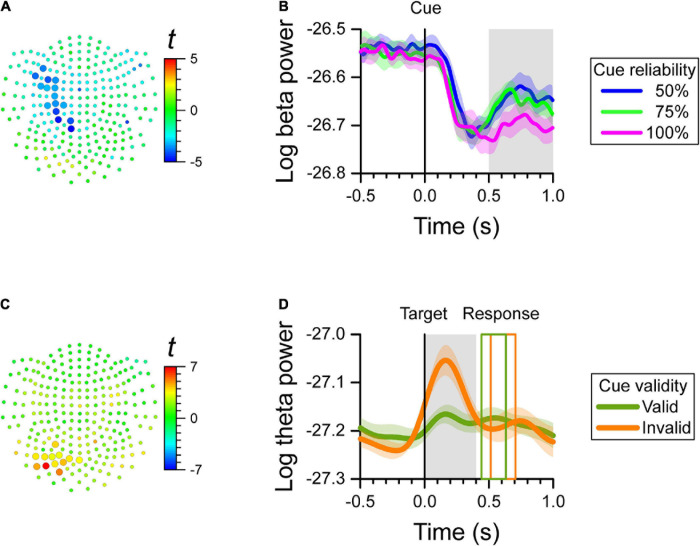
FIGURE 2.
MEG results at the channel level. We found a significant effect of cue reliability on beta power during the late cue period (0.5–1.0 s after cue onset), and a significant cue validity effect on theta power during the reaction time period (0.0–0.4 s after target onset). (A) Map of t-values for the correlation between log-transformed beta power and cue reliability. Channels selected by the cluster-based analysis are plotted as larger symbols. The negative t-values indicate that the greater the cue reliability, the more beta power over left central channels decreased. (B) Cue-aligned time-series of log-transformed beta power of the channels selected in (A) for the 50, 75, and 100% cue reliability conditions. The colored shaded areas indicate the SEM (N = 12 participants) for within-subject designs. The gray shaded area shows the time-window of interest. (C) Map of t-values for the difference in log-transformed theta power between cue validity conditions. Channels selected by the cluster-based analysis are plotted as larger symbols. The positive t-values indicate that theta power over left posterior channels was greater for the invalid-cue trials than for the valid-cue trials. (D) Target-aligned time-series of log-transformed theta power of the channels selected in (C) for the invalid-cue and valid-cue conditions. The colored shaded areas indicate the SEM (N = 12 participants) for within-subject designs. The gray shaded area shows the time-window of interest. The colored rectangles show the average onset and offset of the motor response for the valid-cue and invalid-cue conditions.

