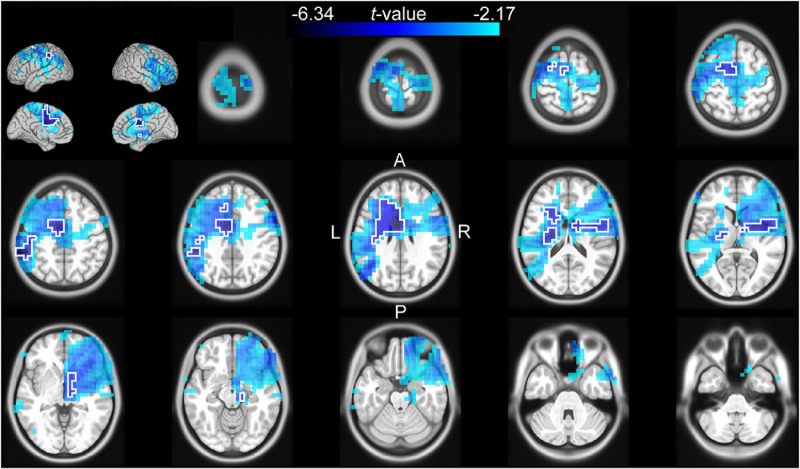
FIGURE 3.
Source analysis of the correlation between the log-transformed beta power and cue reliability during the late cue period (0.5–1 s after cue onset). The t-values of the correlation are mapped onto the transverse slices and surface of the MNI standard brain. The color scale represents negative t-values from the 75th to 100th percentile of the absolute t-value distribution. The cluster-based selected area is surrounded by a white border.

