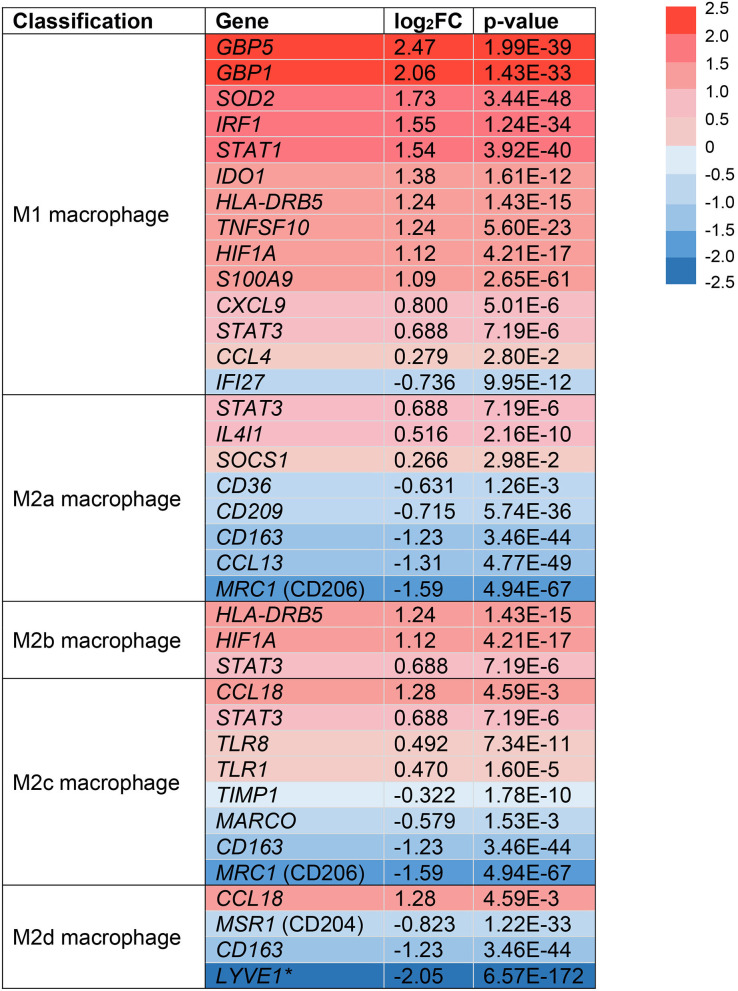
Figure 3.
Monocyte/macrophage populations are transcriptionally polarized toward an M1 macrophage phenotype in HS skin. log2FC of gene expression was calculated by comparing HS samples to HC skin within the monocyte/macrophage clusters. Values that depict an increased log2FC gene expression in HS relative to HC are colored in red and those that depict a decreased expression are colored in blue. *Expressed in tumor-associated macrophages. FC, fold change; HC, healthy control.

