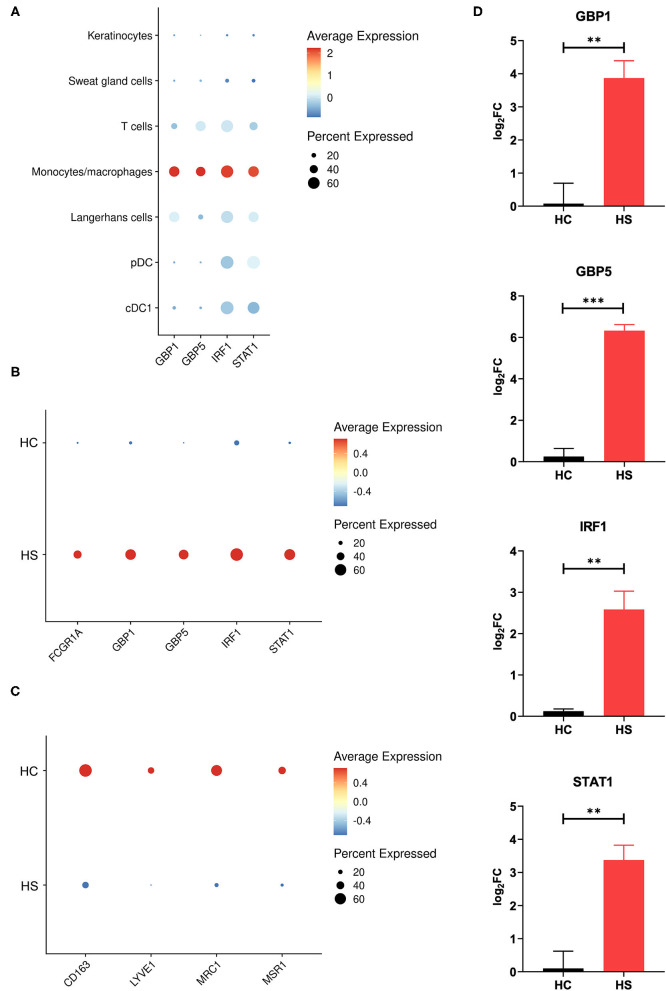
Figure 4.
M1 macrophage genes are more abundantly expressed in HS skin. (A) Dot plot showing the percent expressed and average expression of select M1 macrophage genes between key cellular populations in HS skin. (B) Dot plot showing the percent expressed and average expression of select M1 macrophage genes between HS and HC skin in monocyte/macrophage populations. (C) Dot plot showing the percent expressed and average expression of select M2 macrophage genes between HS and HC skin in monocyte/macrophage populations. (D) qPCR of GBP1 (log2FC = 3.87, **p < 0.01), GBP5 (log2FC = 6.33, ***p < 0.005), IRF1 (log2FC = 2.58, **p < 0.01), and STAT1 (log2FC = 3.38, **p < 0.01) in HS lesions and HC skin. log2FC is expressed as an average of skin samples from 3 HS or HC patients relative to HC skin. Measurements were collected in duplicate. Data is represented as the mean log2FC value +/– standard error of the mean. cDC, conventional dendritic cell; HC, healthy control; pDC, plasmacytoid dendritic cell.

