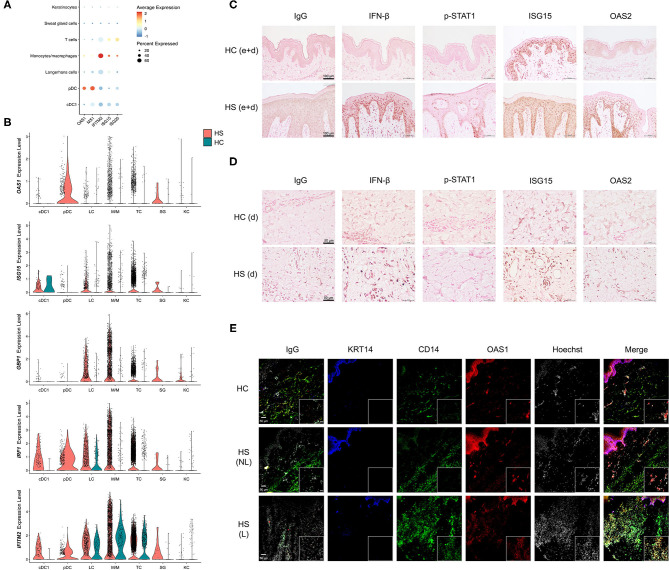
Figure 6.
Key cell populations have increased expression and production of antiviral proteins within HS skin lesions. (A) Dot plot showing the percent expressed and average expression of antiviral proteins between key cellular populations in HS skin. (B) Violin plots of antiviral protein expression within key cellular populations within HS and HC skin. (C,D) Immunohistochemical staining of IFN-β, phospho (p)-STAT1, ISG15, and OAS2 in HS and HC skin with focus on (C) epidermis and dermis (e+d) at 20X (scale bar 100 μm) and (D) dermis (d) at 40X (scale bar 50 μm). (E) Immunofluorescence colocalization staining of CD14 (green) and OAS1 (red) at 20X. Scale bar for the 20X image is 50 μm, whereas, for the zoomed image is 20 μm. KRT (keratin)-14 (blue) staining visualizes the epidermis. cDC, conventional dendritic cell; HC, healthy control; KC, keratinocyte; LC, Langerhans cell; M/M, monocyte/macrophage; pDC, plasmacytoid dendritic cell; SG, sweat gland cell; TC, T cell; NL, non-lesional; L, lesional.

