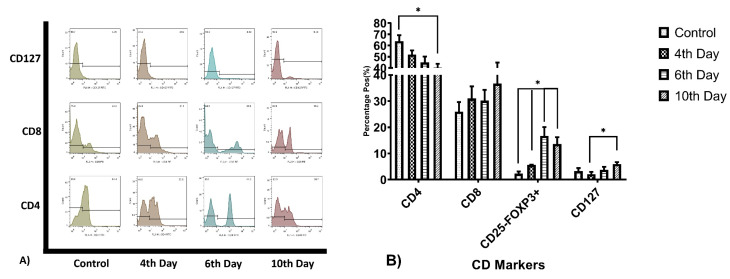
Figure 1.
T-cell subtypes Related CD markers expression percentage. (A) represents CD4, CD8, and CD127 expression ratio on T-cells, because CD25-FoxP3+ subtype calculated and not show on the figure. (B) the bar char summarized the relative expression of the Markers. Th related CD4 expression gradually reducing during the culture period, and Tc marker and Treg and memory T-cells percentage gradually increasing (*P value<0.05).

