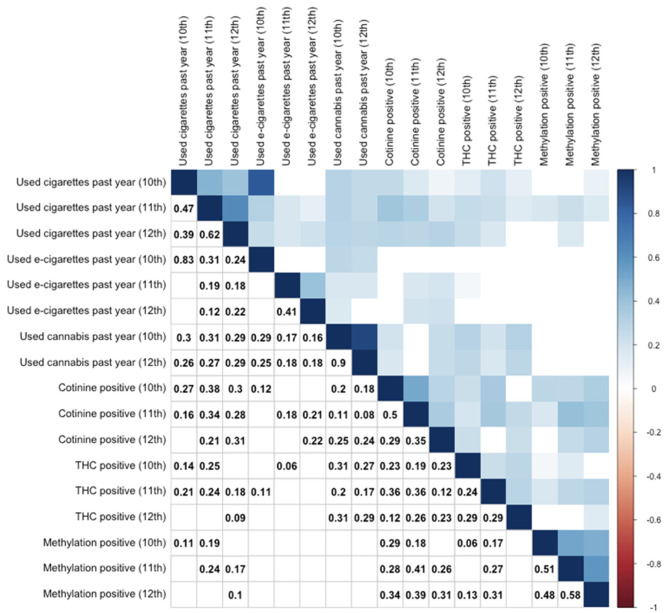
Figure 1.
Correlation table for substance use by self-report and biomarker positivity across 10–12th grades. Use of cigarettes, e-cigarettes, and cannabis are by self-report. Other variables reflect objective biomarkers. Cotinine positive indicates serum cotinine (>3 ng/mL). THC positive indicates serum THC (>0.5 ng/mL). Only significant (p < 0.05) correlations are provided numerically (lower triangle) or by color (upper triangle), while non-significant correlations are left as blank squares. Correlation values represent Spearman rank correlation coefficients.

