Figure 12.
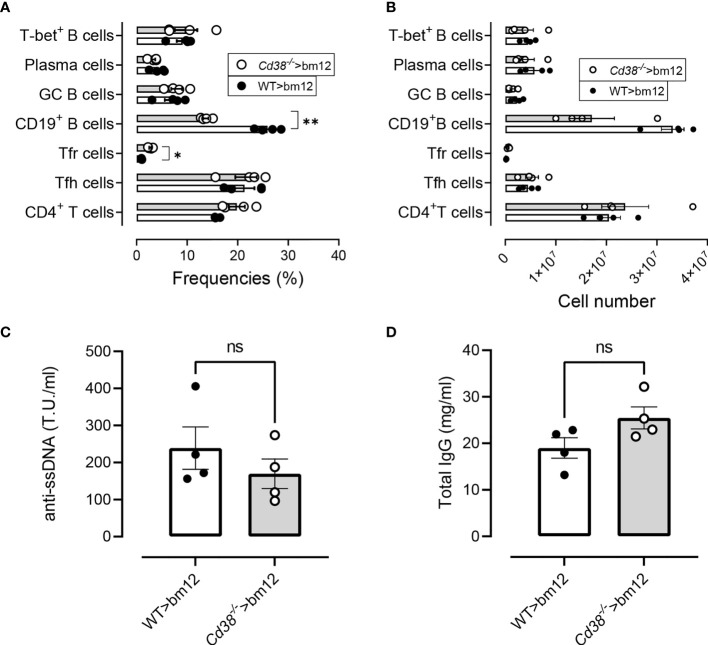
Normal cGVHD response in bm12 mice after the adoptive transfer of Cd38−/− spleen cells. (A) Frequencies of the T- and B-cell subsets analyzed in WT>bm12 mice (closed circles and open bars) and Cd38−/−>bm12 mice (open circles and gray bars), 2 weeks after the adoptive transfer of cells. (B) Total numbers of the same subsets and mice of panel (A). (C) Anti-ssDNA serum levels. (D) Total IgG serum levels. Data in (A–D) are from one out of two independent experiments, each symbol representing one mouse. In (A, B), P-values are for multiple t-tests corrected for multiple comparisons by the Holm–Šidák method. In (C, D), the P-values are for unpaired t-test. ns, not significant (P > 0.05), *P < 0.05, **P < 0.01.

