Figure 2.
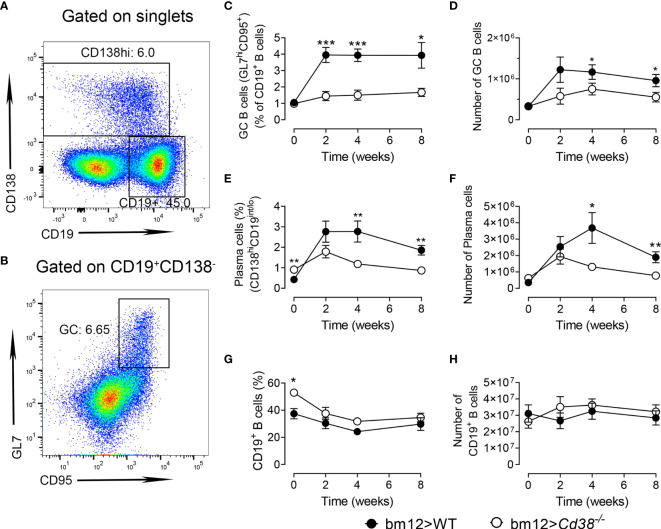
Decreased frequencies of GC B cells and plasma cells upon induction of chronic graft-versus-host disease (cGVHD) in Cd38−/− recipients. WT (closed circles) and Cd38−/− (open circles). (A) Representative flow cytometry plot showing CD19lo-intCD138hi plasma cells and CD19+CD138− B cells from the spleen cells gated on singlets. (B) Flow cytometry plot of CD95+GL7hi GC B cells from gated CD19+CD138− cells. (C) Percentages of GC B cells (of CD19+ B cells). (D) Total number GC B cells. (E) Percentages of plasma cells in spleen cells. (F) Total number of plasma cells in spleen cells. (G) Percentages of CD19+ B cells in the spleen. (H) Total number of CD19+ B cells over time upon the adoptive transfer of bm12 cells. In panels (C–H) WT mice (closed circles) and Cd38−/− mice (open circles). The symbols are the mean values and the vertical bars represent ± SEM. P-values are shown for Welch’s t-test. The results are cumulative data from two to four different experiments per time point and mouse type, each with three to five mice per experiment. *P < 0.05, **P < 0.01, ***P < 0.001.

