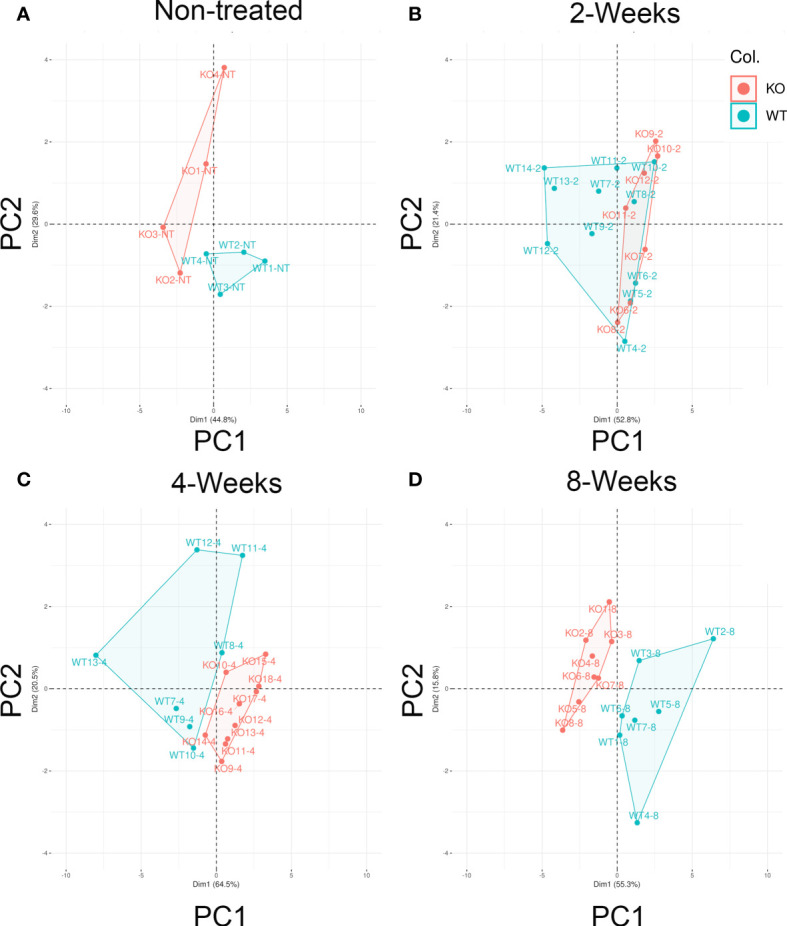
Figure 6.

Distinct clustering of Cd38−/− cGVHD mice. The PCA score plots show the distribution of mice according with two principal components that accumulate the greatest variance (71%–85% range) of the 11 features (variables) tested. Principal component 1 (PC1, x-axis) X% and principal component 2 (PC2, y-axis) Y%. Each panel represents one given time. (A) Non-treated (NT) healthy mice (n = 4, per mouse). (B) Two-weeks cGVHD (n = 11, WT; n = 7, KO). (C) Four-weeks cGVHD (n = 7; WT; n = 10, KO). (D) Eight-weeks cGVHD (n = 7, WT; n = 8, KO). Each dot represents an individual mouse, and except for NT, they are representative of two or more experiments. WT samples are represented by filled red circles. Cd38−/− samples with filled green circles.
