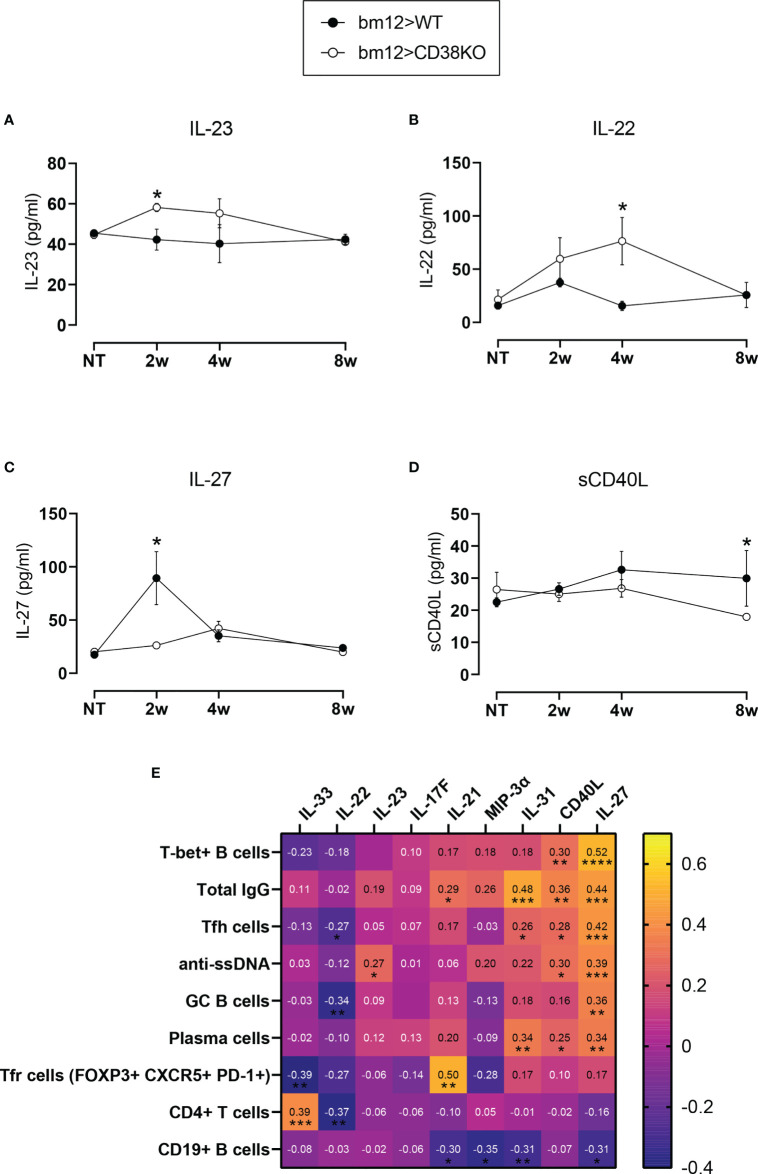
Figure 7.
Abnormal cytokine serum levels in Cd38−/− cGVHD mice. (A) IL-23. (B) IL-22. (C) IL-27. (D) sCD40L. In panels (A–D) WT mice (closed circles) and Cd38−/− mice (open circles). The symbols are the mean values and the vertical bars represent ± SEM. P-values are shown for Welch’s t-test. The results are cumulative data from two to three different experiments per time point and mouse type, each with three to five mice per experiment. (E) Matrix showing Spearman’s r correlation values between cytokines serum levels (horizontal) and the frequencies of the T- and B-cell subsets analyzed + anti-ssDNA and total IgG. Asterisks below r numbers denote statistical significance, which could be positive correlation (no sign) or negative correlation (−). *P < 0.05.

