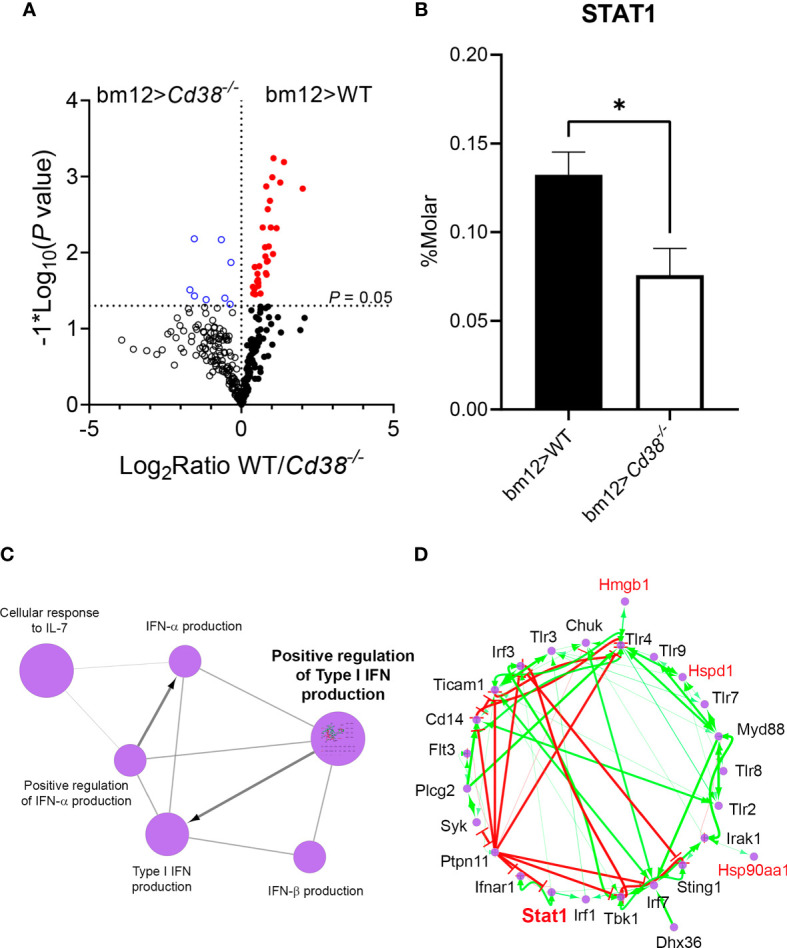
Figure 8.

(A) Volcano plots showing the differences in protein abundance in spleens of bm12>Cd38−/− mice (open blue circles, upper left quadrant) relative to bm12>WT mice (closed red circles, upper right quadrant), 2 weeks after the adoptive transfer. Each circle denotes a different protein, and those above the horizontal dotted line showed statistical significant differences in abundance between mice. P < 0.05. (B) Histogram graph showing STAT1 protein abundance in spleens from bm12>Cd38−/− versus bm12>WT mice at 2 weeks. Histograms represent the mean ± SEM, and the P-values are for unpaired t-test. Proteomic data shown in panels (A, B) are from two biological replicas per mouse type and three technical replicas per sample. (C) Functionally grouped network of GO terms/pathways and genes are visualized using the ClueGO/CluePedia application. Note that in this application the protein accession numbers of the identified proteins are transformed to their gene names. Terms (large purple circles) are linked based on κ score (≥0.3). Edges show the known expression. The edge thickness is scaled between the minimum and maximum scores shown. The size of the terms is related with their statistical significance. (D) “Positive regulation of type I interferon production’” pathway, which showed the highest statistical significance, was investigated in a subnetwork. Gene names of the identified proteins are highlighted in red. Genes not included in the initial selection are highlighted in black. Known activation [activation symbols in green (arrows)] and inhibition (inhibitory symbols in red) effects are shown. Stat1 and some of the genes of the identified proteins (highlighted in red) are acting as activators in this pathway. *P < 0.05.
