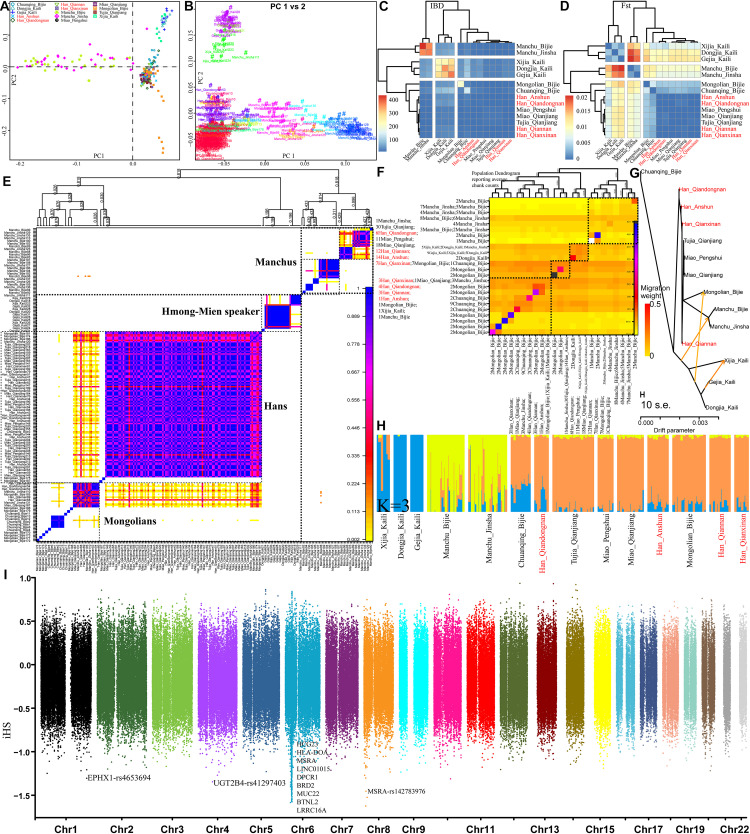
FIGURE 8.
Finer-scale genetic characteristics within 28 southwestern populations. PCA results based on the allele frequency (A) and the shared haplotypes (B). Heatmap was visualized based on the pairwise Fst genetic distance (C) and the shared IBD segments (D); individual (E) or population (F) clustering patterns inferred from the co-ancestry matrix in the fineSTRUCTURE analysis; descriptive analysis results from the TreeMix-based phylogeny (G) and model-based admixture results (H); natural selection signals inferred from the iHS (I).

