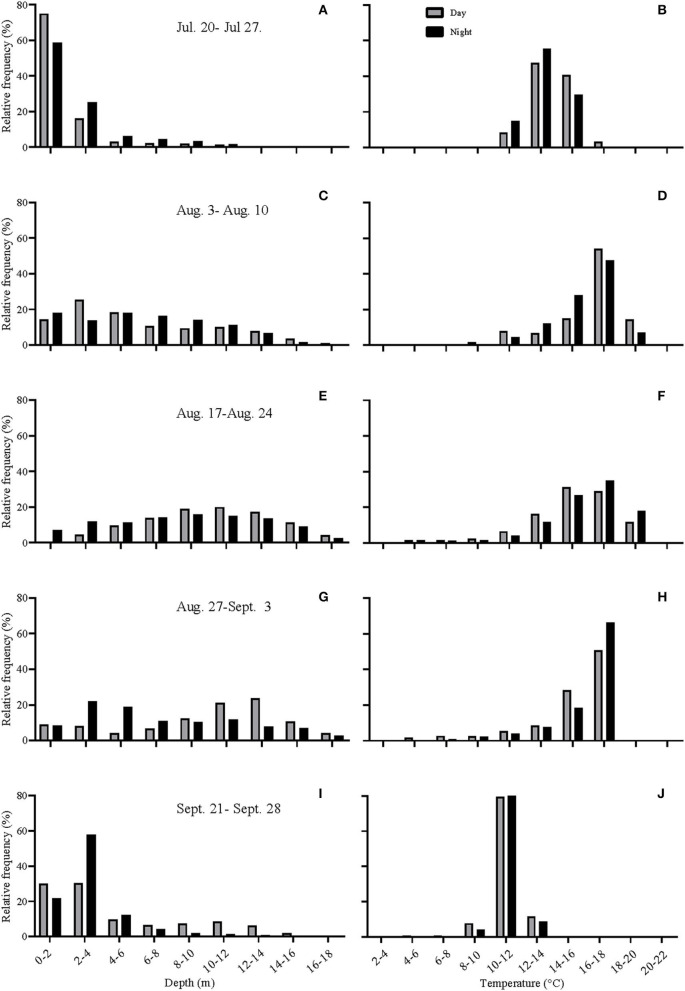
Figure 3.
(A–J) Histograms showing the depth distribution and the temperatures experienced by the fish during various periods of the study. July 20th−27th, ~ 2 weeks after tag implantation; August 3rd−10th, period of highest surface water temperatures; August 17th−24th, start of mortalities in cage-sites in the region; August 27th–September 3rd; period of high mortalities in cage-sites in the region; September 21st−28th, after temperatures cooled down. Gray bars represent day-time values, whereas black bars represent night-time values.

