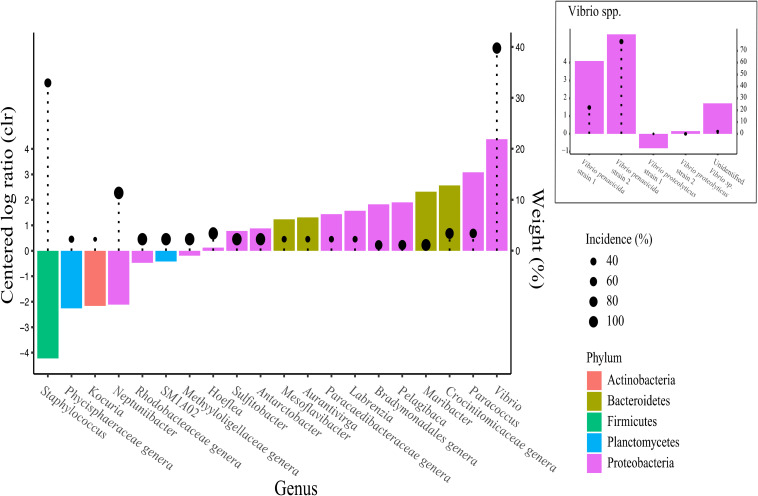
FIGURE 10.
Analysis of composition of microbiomes (ANCOM) of the different taxa between algal feeding ration treatment using the centered log ratio (clr) abundance at genus level. Taxa more abundant under low ration have negative values and vice versa. Weights displayed by lollipops represent the percentage of significant pairwise analyses testing differences in taxa abundance between treatments using each other taxa as denominator. Taxa with higher weights are more likely to be truly affected by the treatment.

