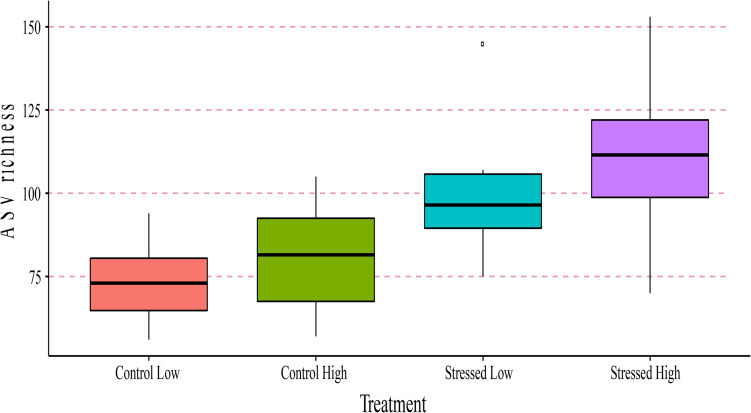
FIGURE 7.
Boxplots of amplicon sequence variant (ASV) richness evaluated in Crassostrea gigas larvae after 96 h (day 15 PF) per treatment condition (Control Low, Control High, Stress Low, and Stress High). Median values and the lower (25%) and upper (75%) quartiles are presented. Whiskers indicate the minimum and maximum values, while outliers are displayed as dots.

