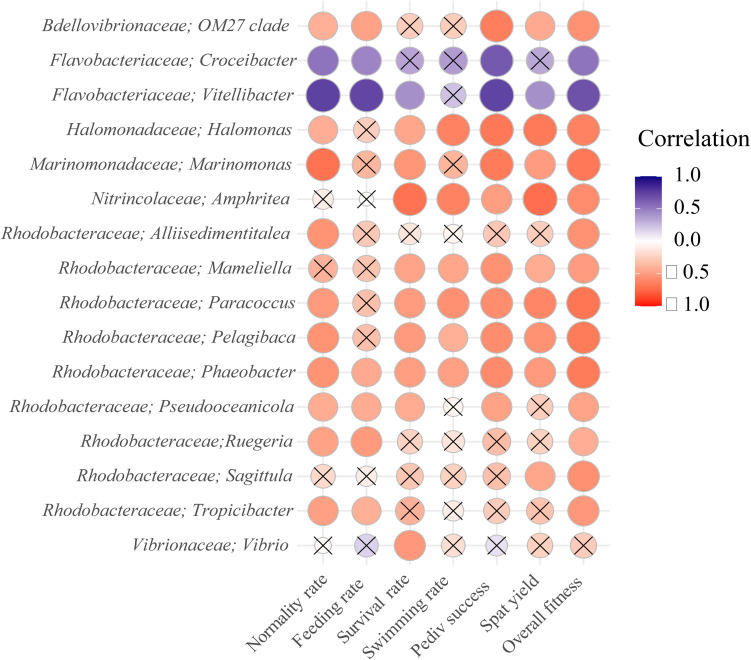
FIGURE 9.
Pearson correlations of bacterial genera with log transformed and normalized oyster fitness metrics after 96 h of exposure. Positive correlations are presented in blue, while negative correlations are presented in red. The overall fitness represents a sum of all fitness metrics. Only the 15 genera with highest absolute correlation with overall fitness are displayed, including the Maribacter and Vibrio genera. Non-significant correlations are marked by a cross sign.

