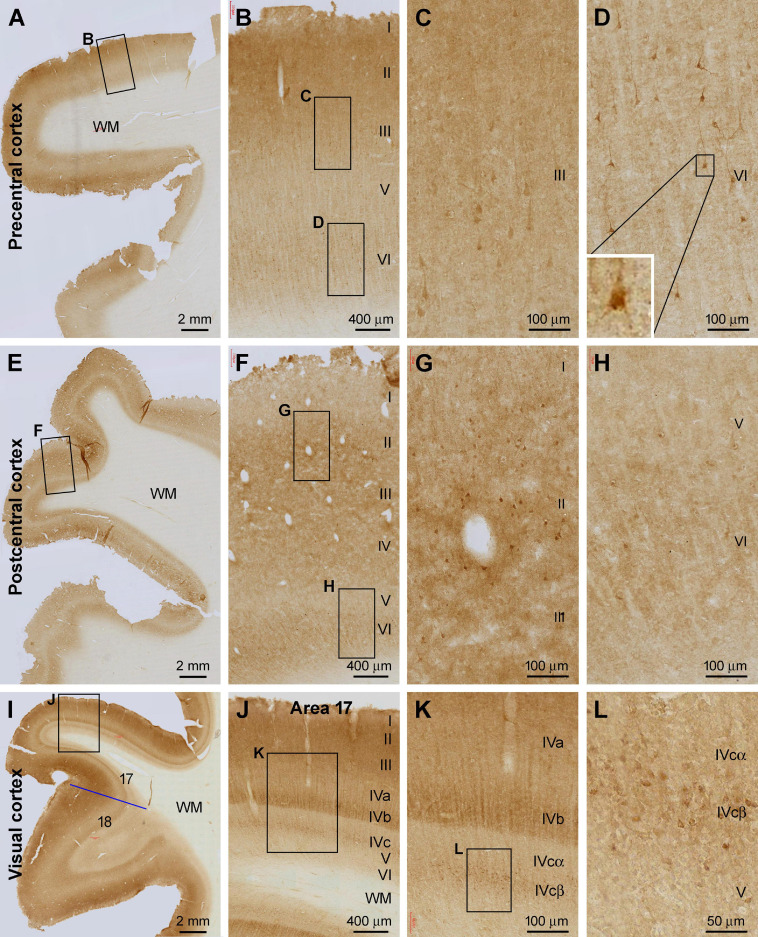
FIGURE 2.
Shank3 IR in the primary motor, somatosensory, and visual cortical areas. (A) shows low power view of the IR in the precentral cortex, with framed areas enlarged as (B–D). (E) shows low magnification view of the IR in the postcentral cortex, with framed areas enlarged as (F–H). (I–L) illustrate the IR in the primary (area 17) and secondary (area 18) visual cortical centers. The sublayers (IVa, IVb, IVcα, and IVcβ) of IV in area 17 exhibit differential intensity. A small group of neuronal somata, along with their apical and basal dendrites, shows moderate to strong IR; most of which appear pyramidal in shape. Scale bars are as indicated in the panels.

