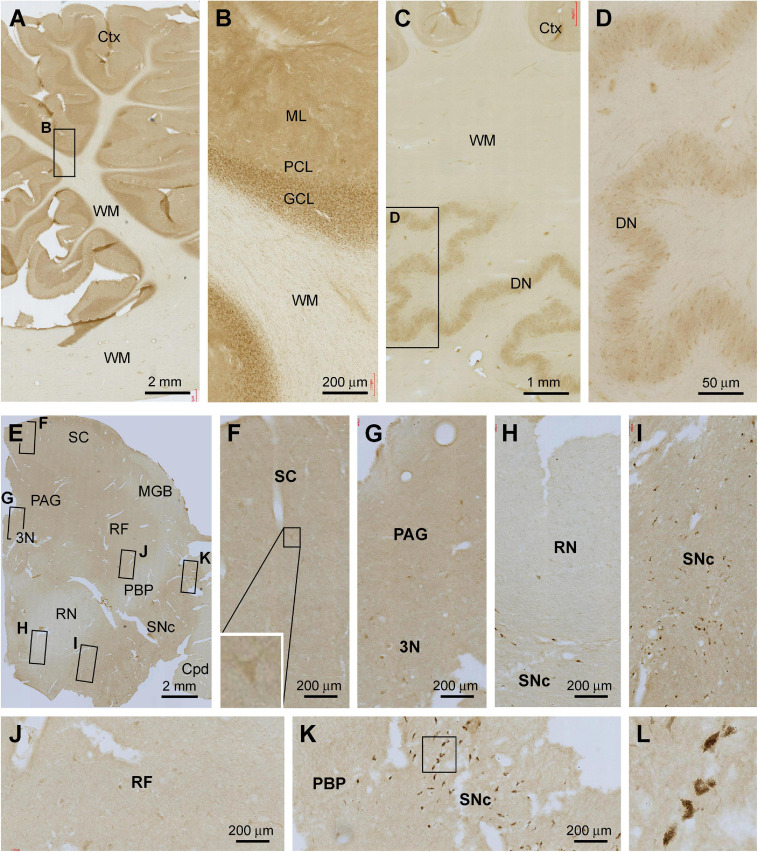
FIGURE 7.
Representative images illustrating Shank3 IR in the cerebellum and midbrain. Panels (A,B) show the labeling in the cerebellar cortex, with diffuse neuropil labeling occurred across the molecular layer (ML), cellular labeling in the granule cell layer (GCL), whereas no labeling in the Purkinje cell layer (PCL) and the white matter (WM) (B). Panels (C,D) show the IR in the dentate nucleus, with the light neuropil and cellular labeling seen in the mantle of this nucleus (D). Panels (E–L) show Shank3 IR in a section at the level of the superior colliculus (SC). Light labeling is present across the section, while individual neuronal perikarya are visible at high magnification in various areas as indicated. The cells in the pas compacta substantia nigra (SNc) are pigmented (unlikely representing specific immunolabeling) (I,K,L). PAG, periaqueduct gray; MGB, medial geniculate body; 3N, third cranial nerve nucleus; RF, reticular formation; RN, red nucleus; PBP, parabrachial pigmented nucleus; Cpd, cerebral peduncle. Scale bars are as indicated in each panel.

