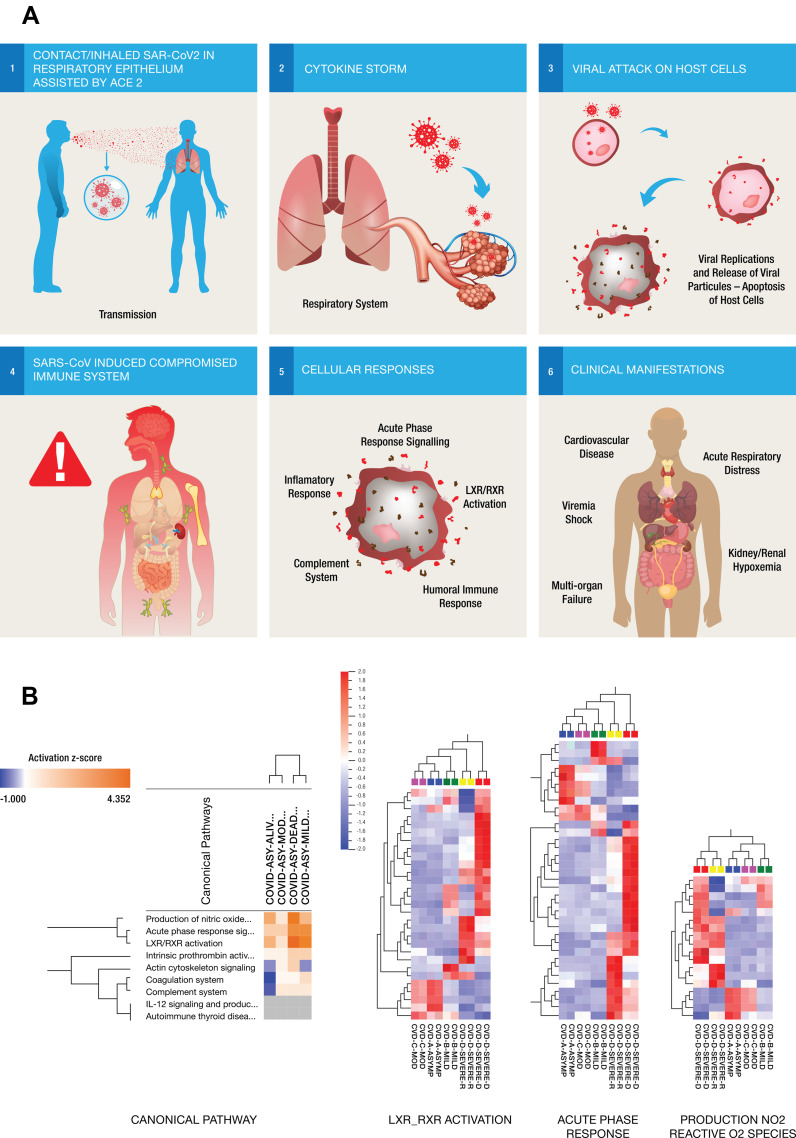
Figure 3.
(A) Six steps Illustrations of the molecular mechanisms of the host immune response to SARS-CoV-2 infection showing the entry of inhaled SAR-CoV2 into the respiratory epithelium (step 1). The acute viral infection triggers responses from a large number of pro-inflammatory cytokines (step 2) and as the virus attacks the host cells (step 3) and releases more viral particles into the circulation, triggering different molecular responses and compromising the host immune system (step 4) through multiple biological pathways (step 5). These pathways might be implicated in the different clinical manifestations of the disease as well as modulating the severity of symptoms or controlling cytokine release in response to viral infection (step 6). (B) Comparison of the canonical pathways from the different pairwise analyses of COVID-19 patients. Overexpression changes are more notable between severe and asymptomatic COVID-19 pairs than in mild or moderate pairs with asymptomatic disease. Hierarchical cluster analysis using the expression dataset of differentially expressed proteins that were implicated in three of the top canonical pathways including LXR-RXR activation, acute-phase reaction and production of nitric oxide and reactive O2 respectively. Asymptomatic and moderate cases showed remarkably similar heat map patterns while recovered severely ill and deceased severely ill were distinctively different. The heat map shows the relative amounts of proteins by color as either upregulation with positive z-scores in red or downregulation with negative z-scores in blue using Qlucore Omics Explorer version 3.7 (Lund, Sweden).

