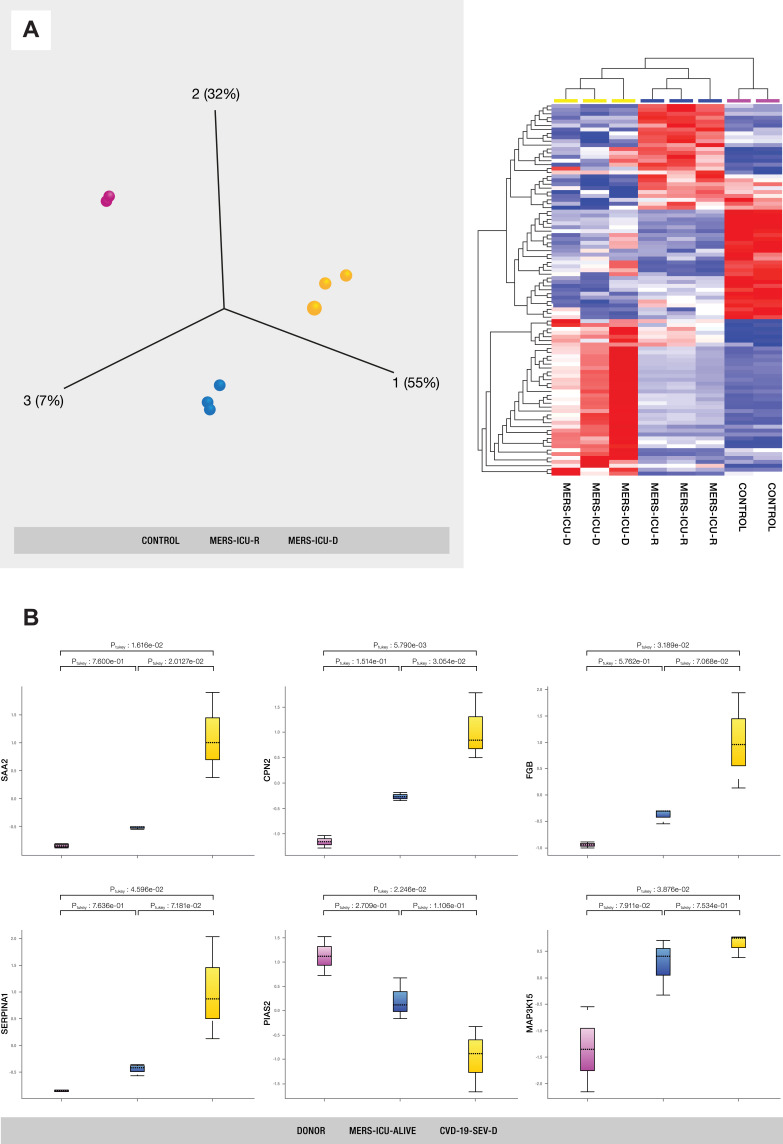
Figure 4.
(A) PCA and hierarchical cluster analysis using the expression dataset of 91 differentially expressed proteins between MERS-CoV patients and control subjects. The expression changes of these proteins separate the samples into three distinct clusters, indicating the potential use of these proteins for accurate stratification and as prognostic biomarkers for MERS-CoV patients (see Supplementary Table S2). (B) The representations of the expression changes of some of these proteins between MERS-CoV patients and control subjects. The normalized quantitative values of individual proteins across all sample groups are depicted as box plots using the Qlucore Omics Explorer version 3.7 (Lund, Sweden) (https://qlucore.com).

