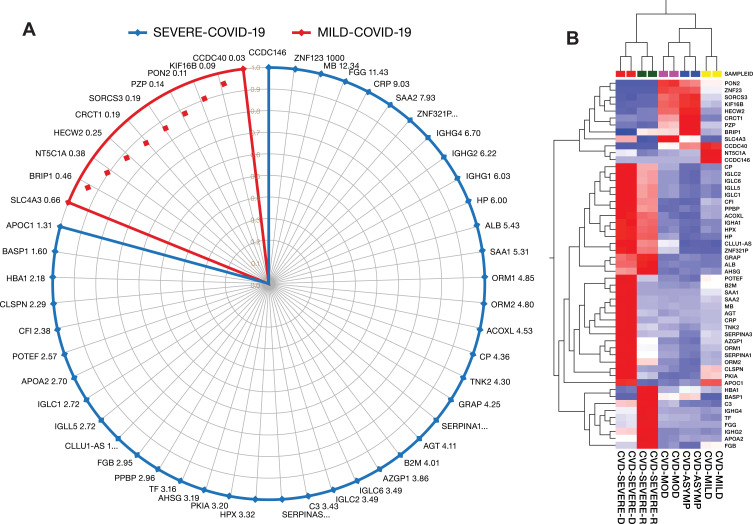
Figure 6.
(A) Potential protein panel for diagnosis of asymptomatic cases, prognosis of COVID-19 disease progression from mild to severe COVID-19, and prediction of disease outcomes among severely ill patients. (B) The heat map shows the relative amounts of proteins by color as either upregulation with positive z-scores in red or downregulation with negative z-scores in blue using Qlucore Omics Explorer version 3.7 (Lund, Sweden).

