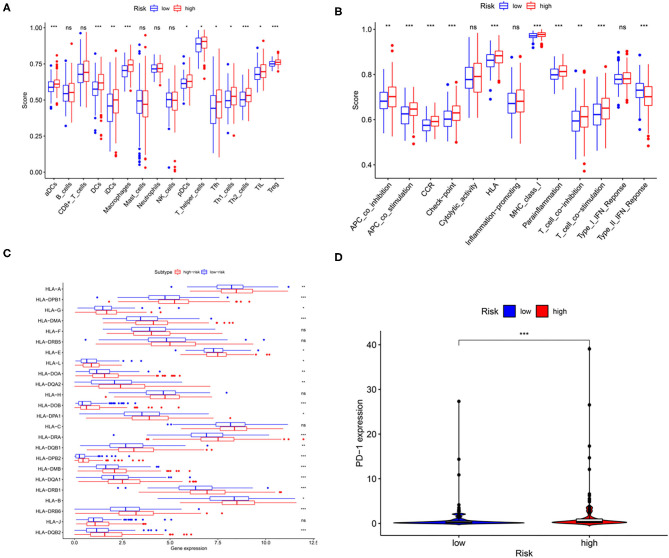
Figure 6.
The relationship among the risk scores, immune cell infiltration, and immune functionality in patients with liver cancer. The relative enrichment of immune cell infiltration (A) and immune functionality (B) in the patients with high- and low-risk liver cancer. HLA family gene (C) and PD-1 expression (D) in patients with high- and low-risk liver cancer. *p < 0.05; **p < 0.01; ***p < 0.001.

