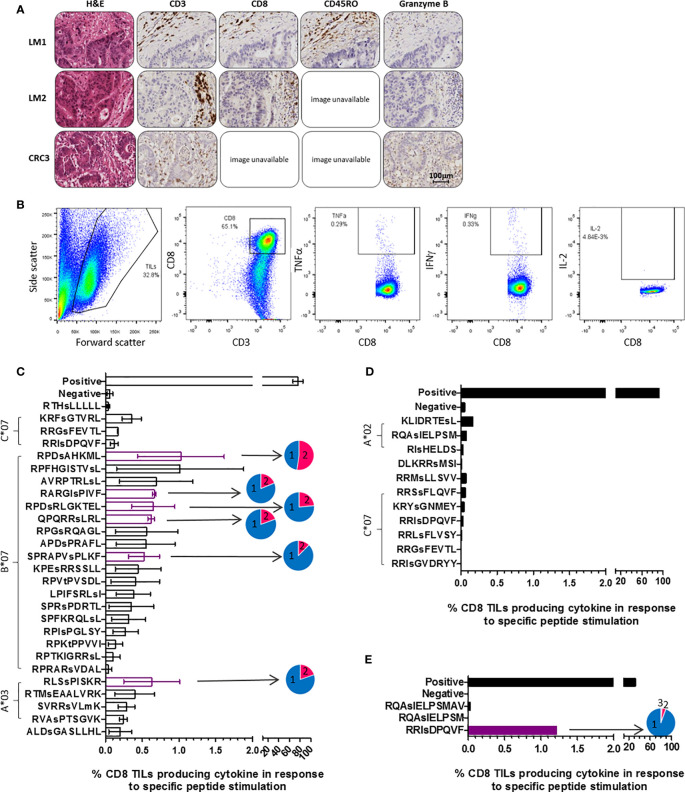
Figure 3.
TILs target phosphopeptides found on CRC tumors. (A) Immunohistochemistry (IHC) of the tumors that TILs were taken from, stained for CD3, CD8, CD45RO and Granzyme B (DAB staining in brown). Some slide images unavailable due to loss of section. (B) ICS gating strategy utilized in assessment of TIL phosphopeptide responses. (C) CRCLM1 TIL cytokine responses to phosphopeptides identified on CRCLM1 (results represent the assay repeated on 2 separate occasions, with differentially expanded TILs), pie charts show the proportion of T cells producing 1 (blue), 2 (pink) and 3 (purple) cytokines. Consistently strong responses are highlighted in purple. (D) CRCLM2 TIL cytokine responses to phosphopeptides identified on CRCLM2. (E) CRC3 TIL cytokine responses to phosphopeptides identified on CRC3, pie chart shows the proportion of T cells producing 1 (blue), 2 (pink) and 3 (purple) cytokines.

