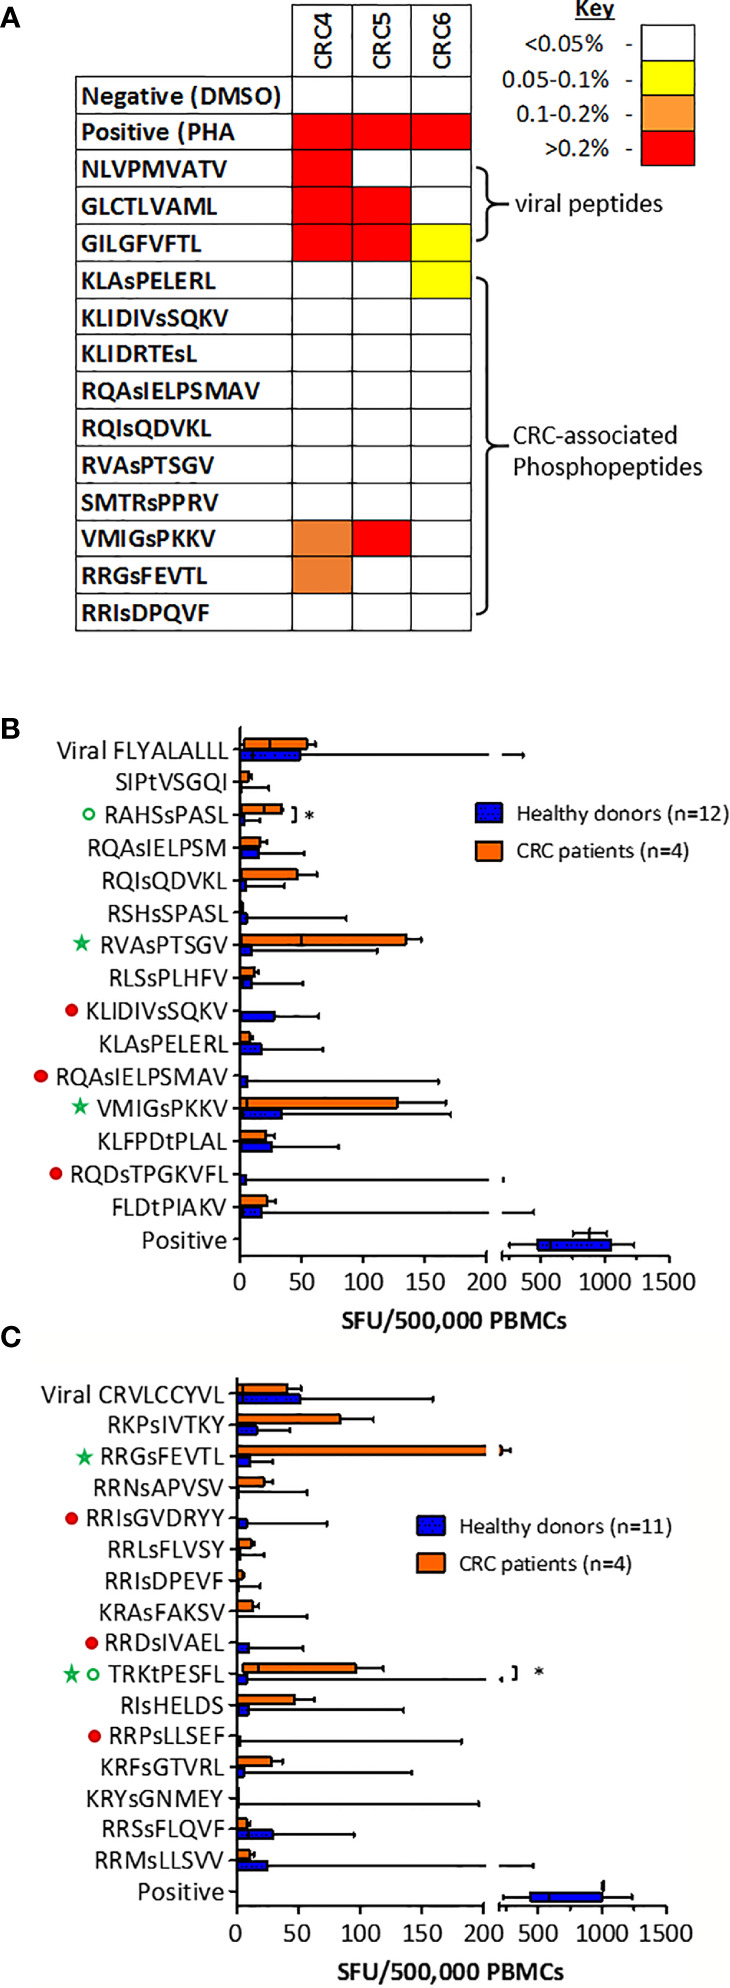
Figure 4.

T cells targeting CRC phosphopeptides are found in a number of patients. (A) Summary of CRC TIL cytokine responses to common phosphopeptides (n=3). Box and whisker plots comparing HD and CRC patient PBMC IFNg production targeting (B) HLA-A*02-associated phosphopeptides and (C) HLA-C*07-associated phosphopeptides; median, interquartile range (box) and minima to maxima (whiskers) are shown. Responses that were absent (red circles) in CRC patients are highlighted. Green circles highlight the responses that were significantly higher in CRC patients than HD (Mann-Whitney U, * denotes p<0.05). Green stars highlight the phosphopeptides to which at least one patient had a high PBMC response.
