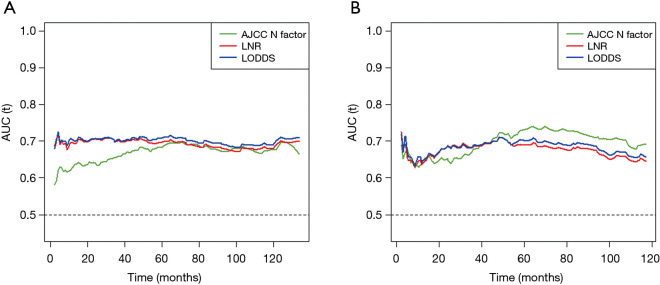
Figure 3.
Time-dependent ROC curves for the AJCC N factor, LNR and LODDS in the group including all young gastric cancer patients (A) and the group of patients with ≤15 examined lymph nodes (B). The horizontal axis represents the time after initial diagnosis and the vertical axis represents the estimated area under the ROC curve for survival at the time of interest. Green, red and blue solid lines represented the estimated AUCs of AJCC N factor, LNR and LODDS, respectively. LNR, lymph node ratio; LODDS, log odds of positive lymph nodes.

