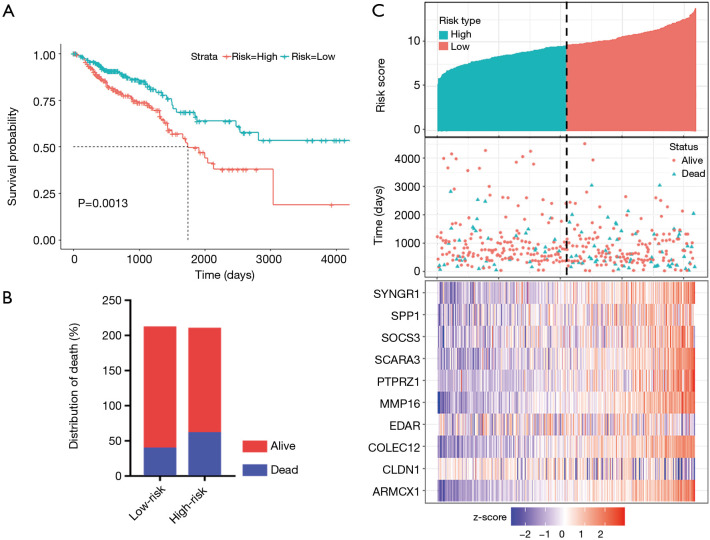
Figure 5.
Test of the prognostic model in the validation set. (A) Kaplan-Meier overall survival curves; (B) the survival distribution of patients in different risk groups; (C) the distribution of the risk value in the validation set of each patient, and the corresponding survival status and heat map of the expression of our 10 genes.

