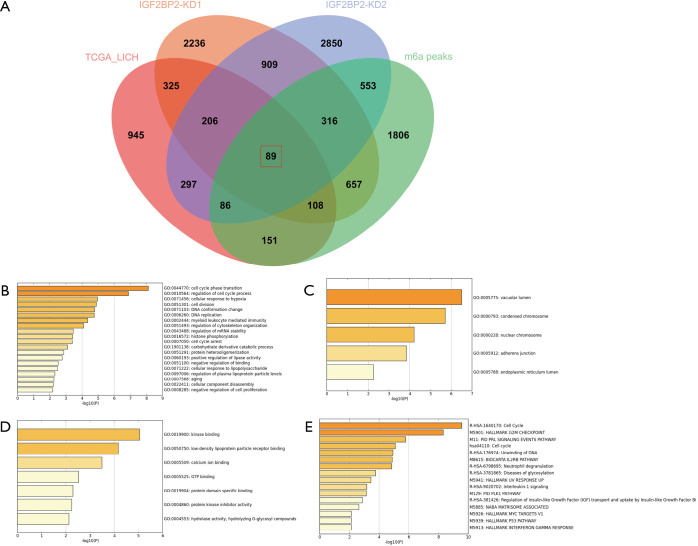
Figure 1.
Identification of DEGs from 4 datasets. (A) Different color areas represent different data sets. The overlapping areas represent the commonly regulated DEGs. DEGs were identified by GEPIA, q<0.01 used as the significance threshold and log2FC >1 as the cutoff. (B) Enriched GO terms of MIRDEGs based on BP. (C) Enriched GO terms of MIRDEGs based on CC. (D) Enriched GO terms of MIRDEGs based on MF. (E) DEGs functional and signaling pathway analysis. DEGs, differentially expressed genes; BP, biological process; CC, molecular function; MF, molecular function; MIRDEGs, modified, IGF2BP2-regulated and differentially expressed genes.

