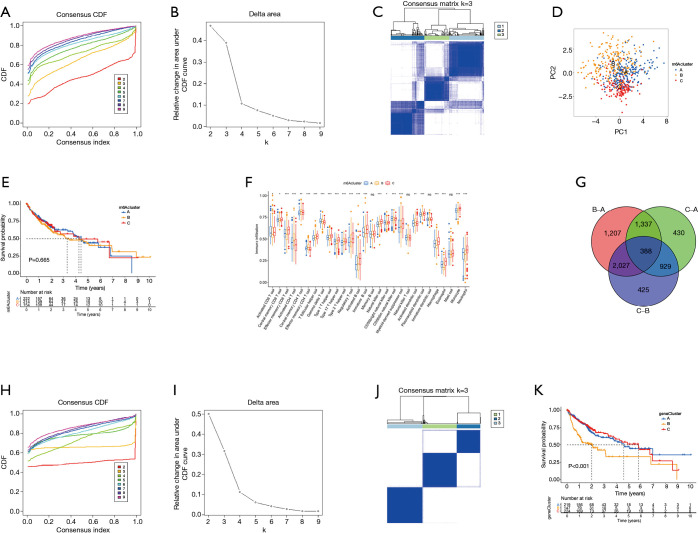
Figure 3.
Genotyping based on m6A methylation regulatory genes. (A,B) The CDF curve and area under the curve in consistency cluster analysis. (C) The consensus fraction matrix of all samples when k=3. The higher the consensus score between two samples, the more likely they are to be grouped into the same cluster in different iterations. (D) A two-dimensional scaling map of the components of the m6A regulatory gene by PCA algorithm. Each dot represents a sample, and the different colors represent three subtypes. (E) Prognostic analysis based on the three m6A regulatory genotypes. (F) Analysis of the three m6A subtypes and immune infiltrating cells. (G) Three DEGs of the m6A subtype are shown in the Venn diagram. (H,I) The CDF curve and the area under the curve in the DEGs concordant cluster analysis of prognosis. (J) The consensus fraction matrix of all samples when k=3. (K) Prognostic analysis based on DEGs classification. m6A, N6-methyladenosine; CDF, cumulative distribution function; PCA, principal component analysis; DEGs differentially expressed genes.

