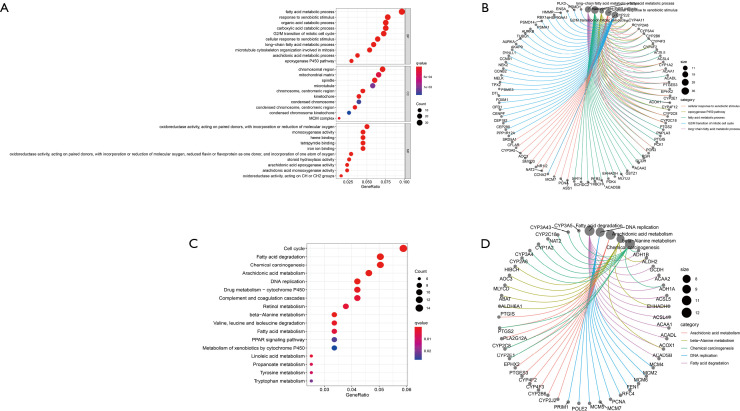
Figure 4.
Analysis of DEGs enrichment function. (A) Bubble diagram of the result of the concentration function. (B) Circus diagram to enrich the results of the function. The red and blue dots indicate the Q value, and the radius of the dots indicates the gene count. (C) Bubble diagram of KEGG pathway analysis results. (D) Circus diagram of KEGG pathway analysis results. The red and blue dots indicate the Q value, and the radius of the dots indicates the gene count. DEG, differentially expressed gene; KEGG, Kyoto Encyclopedia of Genes and Genomes; BP, biological process; CC, cell component; MF, molecular function.

