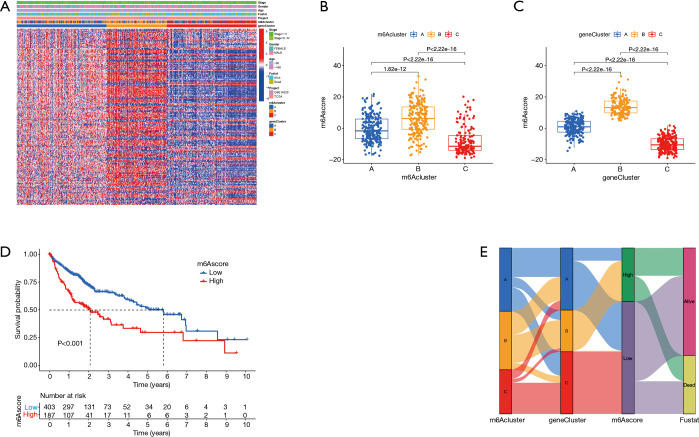
Figure 5.
m6Ascore construction. (A) Correlation analysis between DEGs typing and clinical features and patients were divided into different genomic subtypes. The TNM stage, age, sex, prognosis, molecular subtype, and gene cluster were used as patient annotations. (B) Correlation between the m6Acluster and m6Ascore. (C) Correlation analysis between gene clusters A and the m6Ascore. (D) Prognostic analysis of low and high m6Ascore. (E) Sankey plots of different molecular subtypes (A-C), m6A gene clusters, and m6Ascore. m6A, N6-methyladenosine; DEGs, differentially expressed genes; TNM, tumor-node-metastasis.

