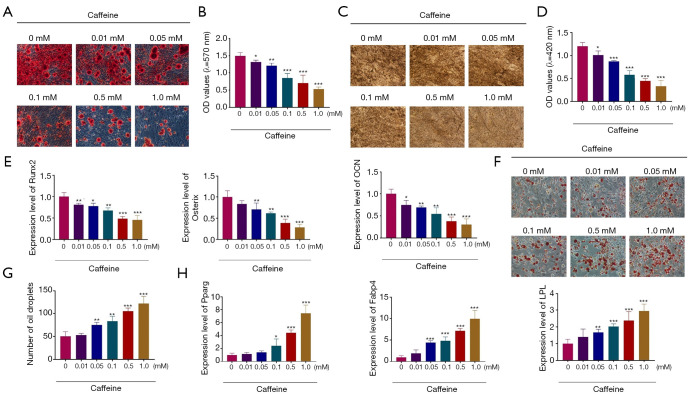
Figure 2.
The roles of caffeine in the differentiation of BMSCs. (A) ARS staining of BMSCs cultured in different concentrations of caffeine (0.01, 0.05, 0.1, 0.5, and 1.0 mM) after osteogenic differentiation for 21 days (100×). (B) Quantitative analysis of ARS staining; (C) ALP staining of BMSCs treated with different concentrations of caffeine (0.01, 0.05, 0.1, 0.5, and 1.0 mM) after osteogenic differentiation for 21 days (100×). (D) Quantitative analysis of ALP staining; (E) QRT-PCR was used to evaluate the gene expression of osteogenic markers in BMSCs after treatment with caffeine. (F,G) After adipogenic induction for 24 days, the droplet formation in BMSCs after caffeine treatment was analyzed by ORO staining (200×). (H) QRT-PCR analysis of Pparg, Fabp4, and LPL expression in BMSCs pretreated with caffeine for 48 h. n=3. *, P<0.05; **, P<0.01; ***, P<0.001. BMSCs, bone marrow mesenchymal stem cells; QRT-PCR, quantitative real-time polymerase chain reaction.

