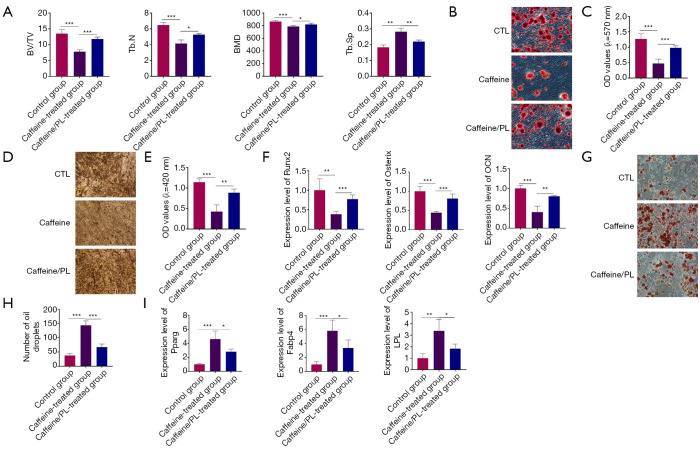
Figure 5.
PL reversed the bone loss of caffeine-induced osteoporotic mice. (A) µCT analysis of the bone microstructure of mice. (B) BMSCs isolated from mice were cultured in the osteo-inductive medium for 21 days and were stained by ARS staining (100×). (C) Quantitative analysis of ARS staining. (D) BMSCs collected from mice were maintained in the osteogenic-inducing medium for 21 days and were stained by ALP staining (100×). (E) Quantitative analysis of ALP staining. (F) The cells cultured in the osteo-inductive medium for 21 days were collected and analyzed for the expression of Runx2, Osterix, and OCN using qRT-PCR analysis. (G) BMSCs cultured in adipo-inductive medium for 24 days were collected and analyzed by ORO staining (200×). (H) Quantitative analysis of ORO staining; (I) BMSCs from mice were induced into adipocytes and applied for the expression of Pparg, Fabp4, and LPL. n=3. *, P<0.05; **, P<0.01; ***, P<0.001. BV/TV, bone volume/tissue volume; Tb.N, trabecular number; BMD, bone mineral density; Tb.Sp, trabecular separation

