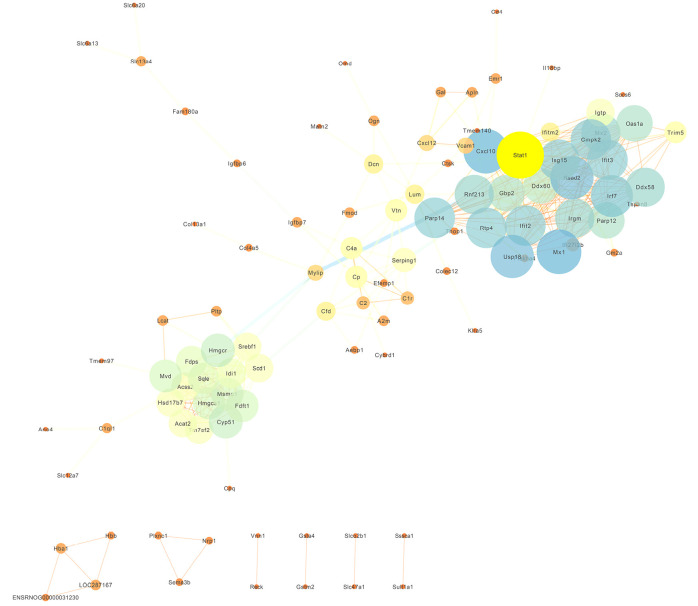
Figure 8.
The PPI network of the brown module. The circles represent the hub genes in the modules, and the lines show the interaction between the hub genes. The different colors represent the different clustering genes. The thicker line represents higher connection strengths. PPI, protein-protein interaction.

