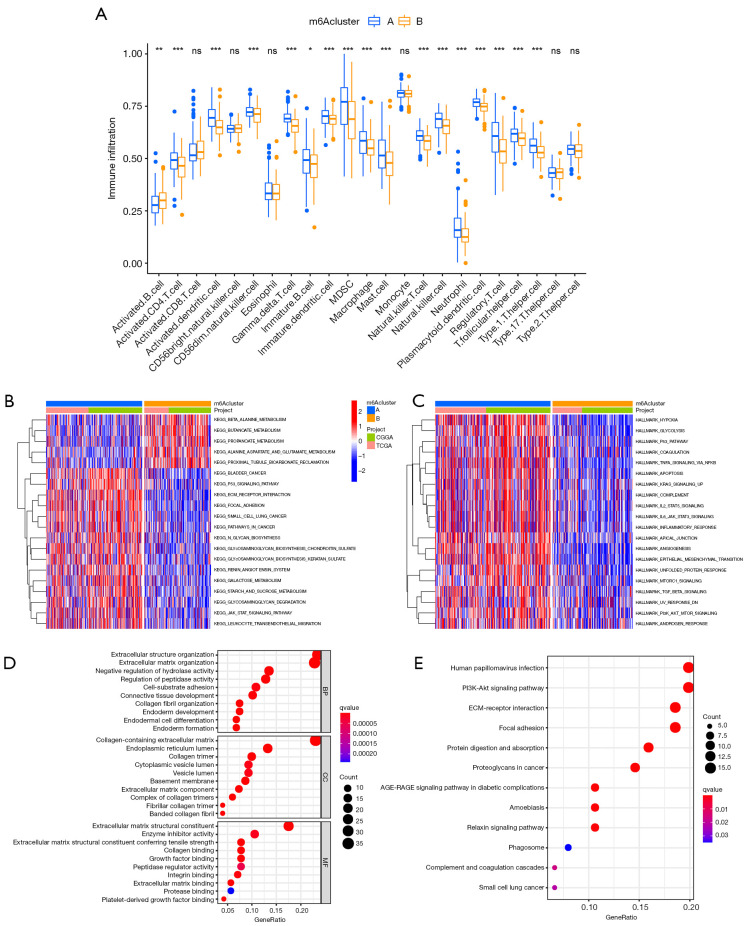
Figure 3.
Interaction and correlation between clusters. (A) Comparison of immune infiltration level of primary glioblastoma patients between N6-methyladenosine (m6A) cluster A and B groups, based on single-sample gene set enrichment analysis algorithm. Data are presented as mean ± SD; ns P>0.05, *P<0.05, **P<0.01, ***P < 0.001. (B,C) Differences in Kyoto Encyclopedia of Genes (KEGG) and HALLMARKS pathways between2 subgroups. (D,E) The Gene Ontology and KEGG analysis of 132 prognostic DEGs between m6A cluster A and m6A cluster B.

